## Bar Chart: Accuracy Comparison of Different Models
### Overview
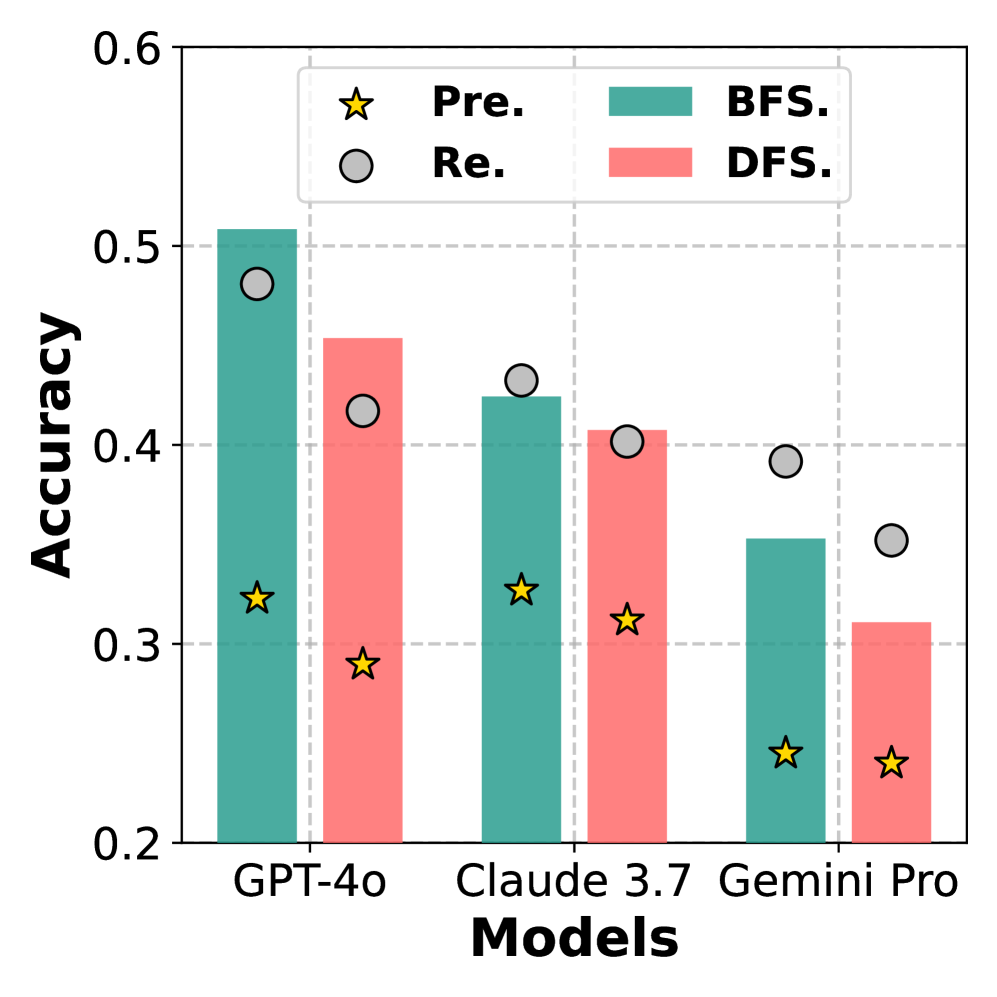
The chart compares the accuracy of three AI models (GPT-4o, Claude 3.7, Gemini Pro) across two evaluation methods (BFS and DFS) and two performance metrics (Pre. and Re.). Bars represent accuracy values, with data points marked by stars (Pre.) and circles (Re.).
### Components/Axes
- **X-axis**: Models (GPT-4o, Claude 3.7, Gemini Pro)
- **Y-axis**: Accuracy (0.2–0.6)
- **Legend**:
- Yellow stars: Pre.
- Gray circles: Re.
- Teal bars: BFS
- Pink bars: DFS
- **Title**: "Accuracy Comparison of Different Models"
### Detailed Analysis
1. **GPT-4o**:
- BFS: ~0.51 (teal bar)
- DFS: ~0.45 (pink bar)
- Pre.: ~0.33 (yellow star)
- Re.: ~0.48 (gray circle)
2. **Claude 3.7**:
- BFS: ~0.43 (teal bar)
- DFS: ~0.41 (pink bar)
- Pre.: ~0.34 (yellow star)
- Re.: ~0.42 (gray circle)
3. **Gemini Pro**:
- BFS: ~0.35 (teal bar)
- DFS: ~0.31 (pink bar)
- Pre.: ~0.25 (yellow star)
- Re.: ~0.36 (gray circle)
### Key Observations
- **BFS vs. DFS**: BFS consistently outperforms DFS across all models (e.g., GPT-4o: 0.51 vs. 0.45).
- **Pre. vs. Re.**: Re. values exceed Pre. for all models (e.g., Gemini Pro: 0.36 vs. 0.25).
- **Model Performance**: GPT-4o achieves the highest accuracy in both BFS and Re., while Gemini Pro has the lowest.
### Interpretation
The data suggests that BFS evaluation methods yield higher accuracy than DFS for all tested models. The gap between Pre. and Re. metrics may indicate improvements in model refinement or evaluation criteria. GPT-4o demonstrates superior performance, potentially due to architectural advantages or training data quality. Gemini Pro’s lower accuracy across all metrics highlights room for optimization. The consistent trend of BFS > DFS and Re. > Pre. implies methodological factors significantly influence outcomes.