## Light Curve Analysis
### Overview
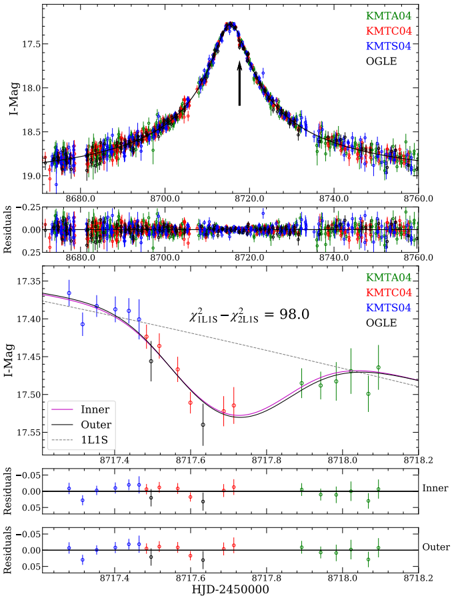
The image presents a series of light curves and residual plots, likely from astronomical observations. The top section shows a broad light curve with data from multiple sources (KMTA04, KMTC04, KMTS04, and OGLE). The middle section focuses on a smaller time range, showing light curves fitted with different models (Inner, Outer, and 1L1S). The bottom sections display residuals for the "Inner" and "Outer" models.
### Components/Axes
**Top Plot:**
* **Y-axis:** I-Mag (I-band Magnitude), ranging from approximately 17.3 to 19.1.
* **X-axis:** HJD-2450000 (Heliocentric Julian Date minus 2450000), ranging from 8680.0 to 8760.0.
* **Data Series:**
* KMTA04 (Green)
* KMTC04 (Red)
* KMTS04 (Blue)
* OGLE (Black)
* **Arrow:** A black arrow points to the peak of the light curve.
**Top Residual Plot:**
* **Y-axis:** Residuals, ranging from -0.25 to 0.25.
* **X-axis:** HJD-2450000, ranging from 8680.0 to 8760.0.
* **Data Series:** Residuals corresponding to the data series in the top plot.
**Middle Plot:**
* **Y-axis:** I-Mag, ranging from 17.35 to 17.55.
* **X-axis:** HJD-2450000, ranging from 8717.4 to 8718.2.
* **Data Series:**
* Inner (Magenta)
* Outer (Black)
* 1L1S (Gray, dashed)
* KMTA04 (Green)
* KMTC04 (Red)
* KMTS04 (Blue)
* OGLE (Black)
* **Text:** "χ²₁L1S - χ²₂L1S = 98.0"
**Bottom Residual Plots:**
* **Y-axis:** Residuals, ranging from -0.05 to 0.05.
* **X-axis:** HJD-2450000, ranging from 8717.4 to 8718.2.
* **Data Series:**
* Inner (Top Residual Plot): Residuals corresponding to the "Inner" model.
* Outer (Bottom Residual Plot): Residuals corresponding to the "Outer" model.
### Detailed Analysis
**Top Plot:**
* The light curve shows a significant brightening event (increase in flux, decrease in magnitude) around HJD-2450000 = 8720.
* The data from different sources (KMTA04, KMTC04, KMTS04, OGLE) generally agree, although there are some discrepancies.
* The peak of the light curve is indicated by a black arrow.
* Before the brightening event, the I-Mag is approximately 19.0. At the peak, the I-Mag reaches approximately 17.3.
**Top Residual Plot:**
* The residuals appear to be randomly distributed around zero, suggesting that the model (represented by the black line in the top plot) fits the data reasonably well.
* There might be some systematic deviations around the peak of the light curve.
**Middle Plot:**
* This plot focuses on the region around the brightening event.
* The "Inner" and "Outer" models appear to fit the data well, with the "Outer" model perhaps capturing the overall shape slightly better.
* The "1L1S" model (dashed gray line) seems to deviate more from the data.
* The equation "χ²₁L1S - χ²₂L1S = 98.0" suggests a comparison of chi-squared values between two models, with a significant difference of 98.0.
**Bottom Residual Plots:**
* The residuals for the "Inner" and "Outer" models are generally small and randomly distributed around zero.
* There might be some subtle differences in the distribution of residuals between the two models.
### Key Observations
* A significant brightening event is observed in the light curve.
* Multiple data sources provide consistent measurements.
* The "Inner" and "Outer" models provide reasonable fits to the data, with the "Outer" model potentially being slightly better.
* The "1L1S" model deviates more from the data.
* The chi-squared difference between two models is significant.
### Interpretation
The data suggests the observation of a transient astronomical event, such as a microlensing event or a supernova. The light curve shows a clear brightening, and the different models attempt to explain the shape of this event. The chi-squared difference indicates that one model (likely the "Outer" model, given its visual fit) provides a significantly better explanation of the data than the "1L1S" model. The residual plots help assess the goodness of fit for each model. The consistency between different data sources strengthens the reliability of the observations. Further analysis would be needed to determine the exact nature of the event.