\n
## Light Curve Analysis: Eclipsing Binary Star System
### Overview
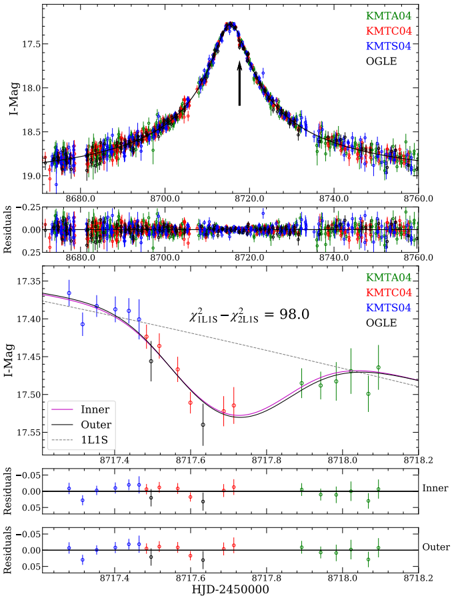
The image presents a light curve analysis of an eclipsing binary star system, displaying brightness (I-Mag) variations over time (HJD-2450000). It consists of two main panels, each with a light curve and corresponding residuals plot. The data is presented for four different observing sources: KMTA04, KMTC04, KMTS04, and OGLE. A chi-squared value comparison is also provided.
### Components/Axes
* **X-axis (both panels):** HJD-2450000 (Heliocentric Julian Date minus 2450000). Scale ranges from approximately 8680.0 to 8760.0 in the top panel and 8717.4 to 8718.2 in the bottom panel.
* **Y-axis (top panel):** I-Mag (Instrumental Magnitude). Scale ranges from approximately 17.3 to 19.2.
* **Y-axis (bottom panel):** I-Mag (Instrumental Magnitude). Scale ranges from approximately 17.35 to 17.6.
* **Y-axis (Residuals plots):** Residuals. Scale ranges from approximately -0.25 to 0.25 (top panel) and -0.05 to 0.05 (bottom panel).
* **Legend (top-right, both panels):** KMTA04 (black), KMTC04 (red), KMTS04 (green), OGLE (blue).
* **Legend (bottom panel):** Inner (blue), Outer (red), 1LIS (black).
* **Text Annotation:** χ²<sub>1LIS</sub> - χ²<sub>2LIS</sub> = 98.0
### Detailed Analysis or Content Details
**Top Panel:**
* **KMTA04 (Black):** The data points show a relatively smooth curve with some scatter. Around HJD 8720.0, there's a sharp peak, reaching a minimum I-Mag of approximately 17.4. Before and after the peak, the magnitude increases, reaching around 18.5.
* **KMTC04 (Red):** Similar to KMTA04, but with more scatter. The peak is around HJD 8720.0, with a minimum I-Mag of approximately 17.4.
* **KMTS04 (Green):** Shows a similar trend to the other datasets, with a peak around HJD 8720.0 and a minimum I-Mag of approximately 17.5.
* **OGLE (Blue):** Displays a more pronounced peak around HJD 8720.0, with a minimum I-Mag of approximately 17.3. The data is more densely sampled than the others.
* **Arrow:** A black arrow points to the peak around HJD 8720.0.
**Top Residuals Plot:**
* The residuals for all four datasets are scattered around zero, indicating a reasonable fit of the model to the data. There are no obvious systematic trends.
**Bottom Panel:**
* **Inner (Blue):** A relatively flat line around I-Mag = 17.55, with some scatter.
* **Outer (Red):** A relatively flat line around I-Mag = 17.55, with some scatter.
* **1LIS (Black):** A downward sloping curve from approximately I-Mag = 17.45 at HJD 8717.4 to approximately I-Mag = 17.55 at HJD 8718.2.
**Bottom Residuals Plot:**
* The residuals for Inner (blue) and Outer (red) are scattered around zero.
### Key Observations
* The light curve exhibits a clear eclipse-like dip around HJD 8720.0, suggesting an eclipsing binary system.
* The OGLE data appears to have the highest precision and density.
* The residuals suggest that the model fits the data reasonably well.
* The chi-squared comparison (χ²<sub>1LIS</sub> - χ²<sub>2LIS</sub> = 98.0) indicates a significant difference between two different models (1LIS and 2LIS), potentially suggesting that one model provides a better fit to the data.
* The bottom panel focuses on a smaller time range and shows the contribution of "Inner" and "Outer" components to the overall light curve, along with the 1LIS model.
### Interpretation
The data strongly suggests the presence of an eclipsing binary star system. The dip in brightness around HJD 8720.0 is caused by one star passing in front of the other, blocking some of its light. The different observing sources (KMTA04, KMTC04, KMTS04, OGLE) provide independent measurements of the same phenomenon, increasing the confidence in the results.
The residuals plots indicate that the model used to fit the light curve is a good approximation of the observed data. The chi-squared comparison suggests that the 1LIS model is significantly better than the 2LIS model, implying that the 1LIS model more accurately represents the physical processes occurring in the system.
The bottom panel provides a closer look at the eclipse event, separating the contributions of the "Inner" and "Outer" stars. The 1LIS model appears to be a linear approximation of the light curve during the eclipse. The difference in magnitude between the "Inner" and "Outer" components could be related to their relative sizes or temperatures.
The arrow pointing to the peak likely highlights the primary eclipse event, where the larger or brighter star is obscured by the smaller or dimmer star. The overall analysis provides valuable insights into the orbital parameters and physical characteristics of the eclipsing binary system.