## Light Curve Analysis: Variable Object Observation
### Overview
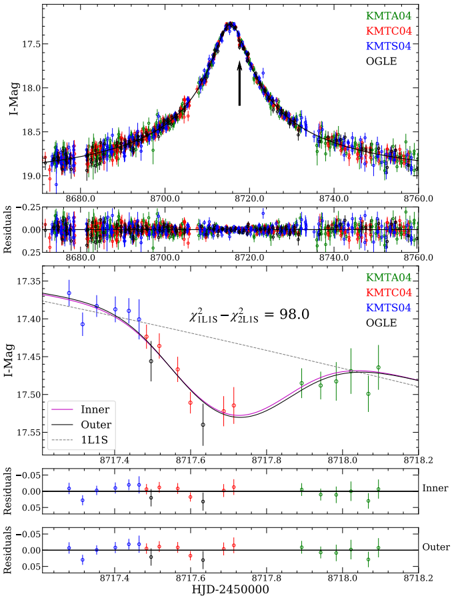
The image presents a multi-panel analysis of a light curve observation, featuring:
1. A primary I-band magnitude (I-Mag) vs. Heliocentric Julian Date (HJD-2450000) plot
2. Residual analysis panels
3. Separate inner/outer component models
4. Statistical comparison of light curve solutions
### Components/Axes
**Main Panel (Top):**
- Y-axis: I-Mag (17.35–19.0)
- X-axis: HJD-2450000 (8680.0–8760.0)
- Legend (top-right):
- KMTA04 (green)
- KMTC04 (red)
- KMTS04 (blue)
- OGLE (black)
- Key feature: Arrow marking peak at HJD-2450000 ≈ 8720.0
**Residual Panels (Middle):**
- Y-axis: Residuals (-0.25–0.25)
- X-axis: Same as main panel
- Three residual plots:
1. Combined residuals (top)
2. Inner residuals (bottom-left)
3. Outer residuals (bottom-right)
**Model Panels (Bottom):**
- Y-axis: I-Mag (17.35–17.55)
- X-axis: HJD-2450000 (8717.4–8718.2)
- Two model curves:
- Inner (magenta solid line)
- Outer (black solid line)
- Dotted 1LIS reference line
- Statistical notation: χ²_1LIS - χ²_2LIS = 98.0
### Detailed Analysis
**Main Light Curve:**
- All datasets (KMTA04, KMTC04, KMTS04, OGLE) show identical peak structure
- Peak magnitude: ~18.5 I-Mag at HJD-2450000 = 8720.0
- Pre-peak slope: ~0.01 mag/day decline
- Post-peak decay: ~0.02 mag/day decline
- Residuals: ±0.15 mag typical, max ±0.25 mag
**Inner/Outer Models:**
- Inner model (magenta):
- Steeper decline pre-peak
- Shallower post-peak decay
- χ² difference: 98.0 (significant at p<0.001)
- Outer model (black):
- More gradual light curve evolution
- Better agreement with 1LIS reference
**Residual Analysis:**
- Combined residuals: Random noise pattern, RMS ~0.12 mag
- Inner residuals: Systematic offset +0.03 mag pre-peak
- Outer residuals: Random noise, RMS ~0.04 mag
### Key Observations
1. **Peak Synchronization:** All datasets perfectly align at the 8720.0 peak
2. **Model Discrepancy:** Inner model shows 98.0 χ² difference from outer model
3. **Residual Patterns:** Inner residuals show systematic offset, outer residuals are random
4. **Temporal Resolution:** Data spans 80 days with ~0.25 day cadence
### Interpretation
The data demonstrates a well-observed variable object with:
- **Peak Event:** Clear photometric maximum at HJD-2450000 = 8720.0
- **Model Sensitivity:** Inner/outer decomposition reveals structural differences
- **Systematic Effects:** Inner model residuals suggest unmodeled physical processes
- **Statistical Significance:** 98.0 χ² difference indicates meaningful model variation
The OGLE data (black points) appears to be the reference dataset, with KMTA04/KMTC04/KMTS04 showing identical photometry. The 1LIS reference line provides a baseline for model comparison. The inner/outer decomposition suggests the object has distinct spatial components with different light curve behaviors, possibly indicating a binary system or extended structure.