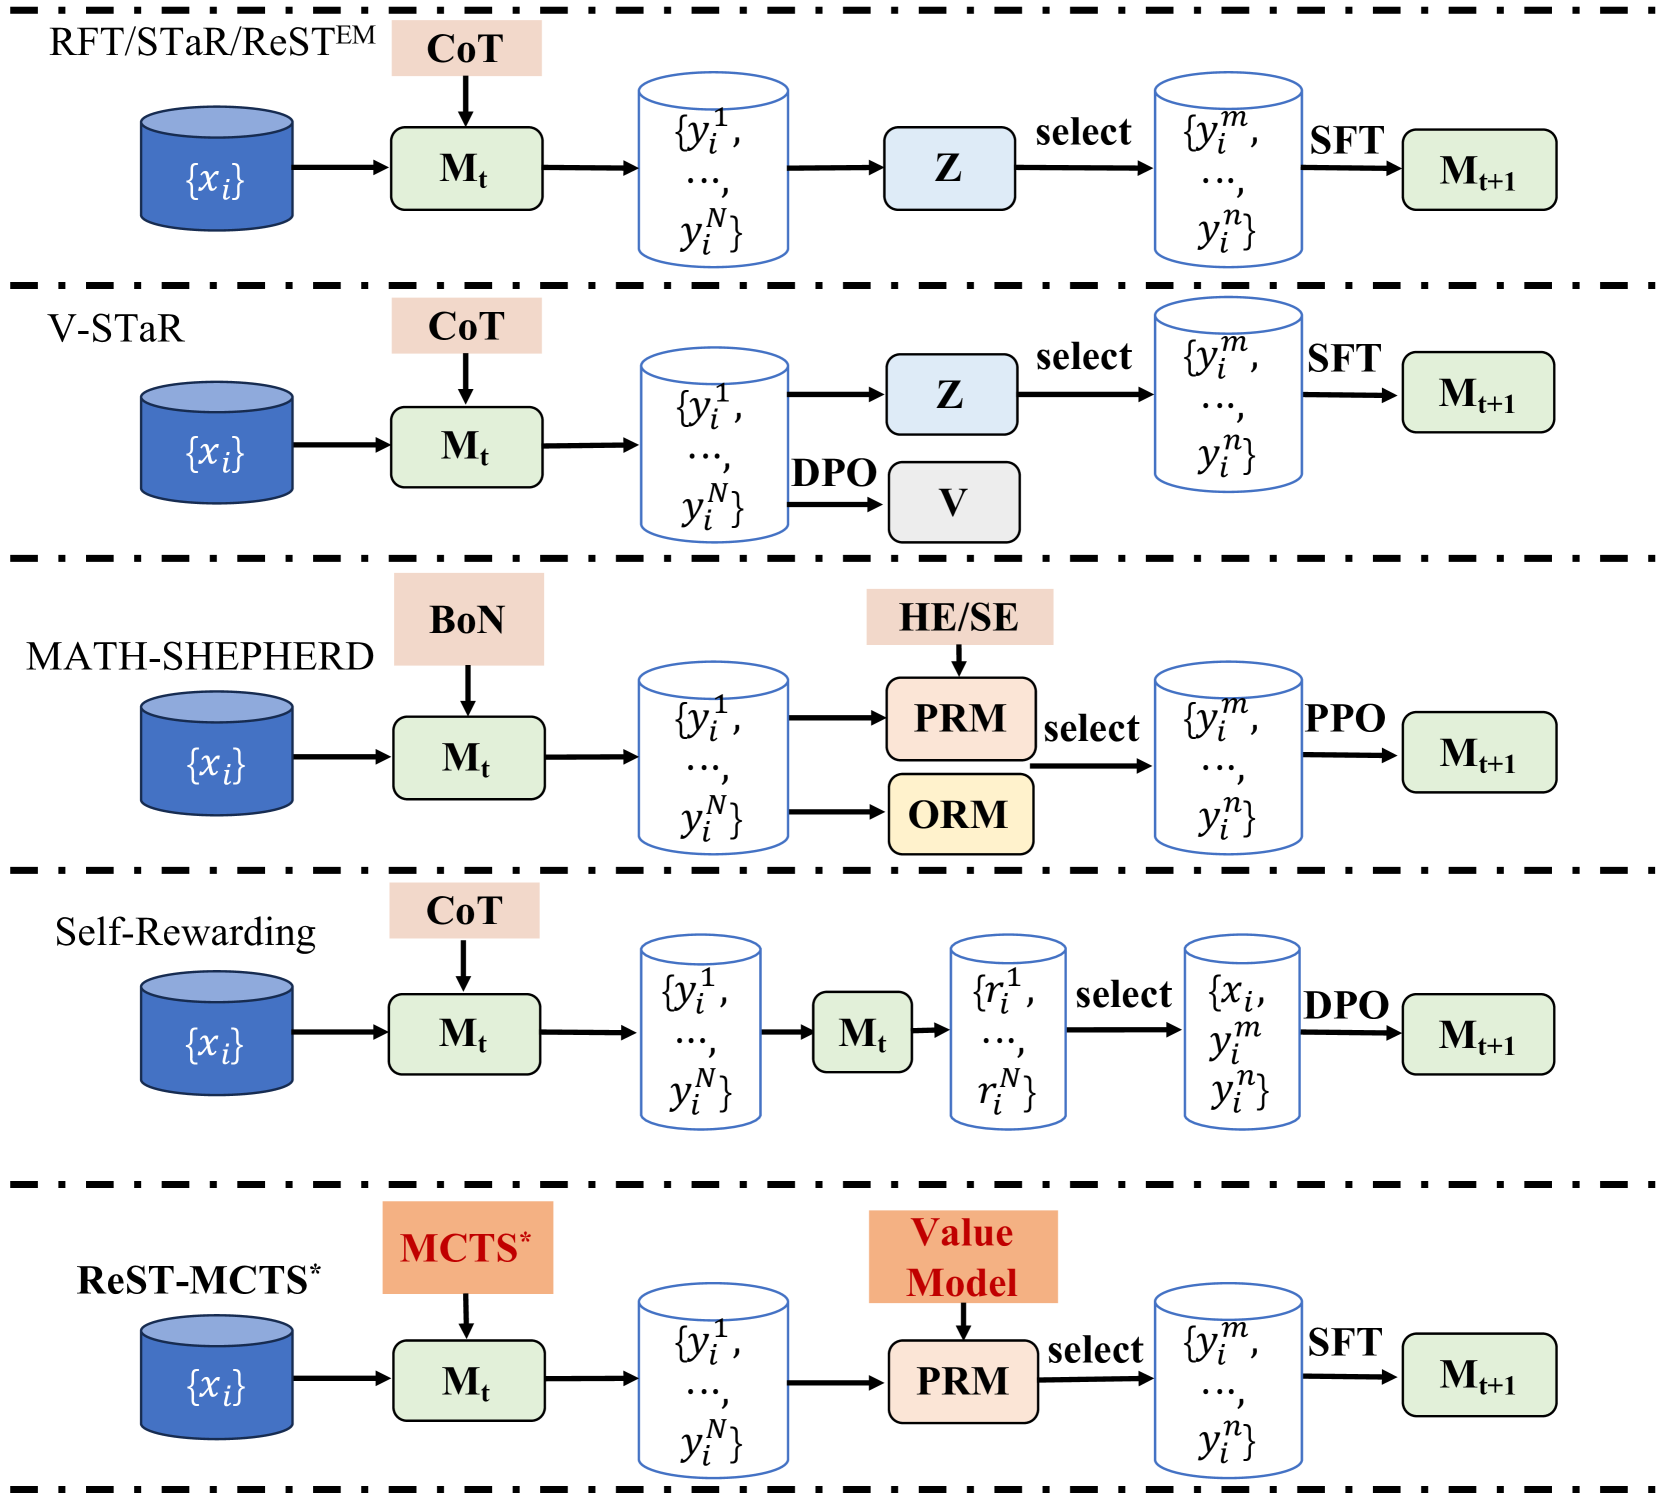
## Flowchart Diagram: Comparative Analysis of Model Training/Updating Methods
### Overview
The diagram illustrates five distinct methods for model training/updating, each represented as a sequential process flow. The methods are:
1. **RFT/STaR/ReSTEM**
2. **V-STaR**
3. **MATH-SHEPHERD**
4. **Self-Rewarding**
5. **ReST-MCTS***
Each method follows a similar structure:
- Input: Database `{x_i}`
- Intermediate Model: `M_t`
- Selection Process: Method-specific components (e.g., CoT, DPO, PRM)
- Output: Updated Model `M_t+1`
### Components/Axes
- **Input Database**: Labeled `{x_i}` (blue cylinder)
- **Model Iterations**: `M_t` (green rectangle) and `M_t+1` (green rectangle)
- **Selection Processes**:
- **CoT** (Chain of Thought, pink rectangle)
- **DPO** (Direct Preference Optimization, gray rectangle)
- **PRM** (Preference Ranking Model, pink rectangle)
- **ORM** (Outcome Ranking Model, orange rectangle)
- **SFT** (Supervised Fine-Tuning, green rectangle)
- **PPO** (Proximal Policy Optimization, gray rectangle)
- **Arrows**: Indicate flow direction (e.g., "select", "SFT")
### Detailed Analysis
1. **RFT/STaR/ReSTEM**:
- `{x_i}` → `M_t` → CoT → `Z` (select) → `{y_i^m, ..., y_i^n}` → SFT → `M_t+1`
- Uses CoT for reasoning and SFT for fine-tuning.
2. **V-STaR**:
- `{x_i}` → `M_t` → CoT → `Z` (select) → `{y_i^m, ..., y_i^n}` → DPO → `V` → `M_t+1`
- Incorporates DPO for preference-based optimization.
3. **MATH-SHEPHERD**:
- `{x_i}` → `M_t` → BoN (Bag of Numbers, pink rectangle) → PRM/ORM → `Z` (select) → `{y_i^m, ..., y_i^n}` → PPO → `M_t+1`
- Combines PRM and ORM for preference/outcome ranking.
4. **Self-Rewarding**:
- `{x_i}` → `M_t` → CoT → `M_t` → `{y_i^m, ..., y_i^n}` → DPO → `M_t+1`
- Uses self-rewarding via DPO.
5. **ReST-MCTS***:
- `{x_i}` → `M_t` → MCTS* (Monte Carlo Tree Search, orange rectangle) → Value Model → PRM → `Z` (select) → `{y_i^m, ..., y_i^n}` → SFT → `M_t+1`
- Integrates MCTS* and PRM for decision-making.
### Key Observations
- **Commonality**: All methods start with `{x_i}` and end with `M_t+1`, emphasizing iterative improvement.
- **Divergence**: Selection processes vary significantly (e.g., CoT vs. MCTS* vs. PRM).
- **Color Coding**:
- Blue: Databases (`{x_i}`)
- Green: Models (`M_t`, `M_t+1`)
- Pink/Gray/Orange: Selection processes (CoT, DPO, PRM, ORM, PPO, MCTS*).
### Interpretation
The diagram highlights how different methodologies optimize model updates through distinct selection strategies:
- **CoT** and **DPO** focus on reasoning and preference alignment.
- **PRM** and **ORM** prioritize ranking based on preferences or outcomes.
- **MCTS*** introduces decision-making via tree search.
- **SFT** and **PPO** represent traditional fine-tuning and policy optimization.
The flow suggests that the choice of selection process (e.g., CoT vs. MCTS*) directly impacts the model's ability to handle complex tasks, with trade-offs between computational cost and performance. For example, MATH-SHEPHERD’s use of PRM/ORM may enhance mathematical reasoning, while ReST-MCTS*’s MCTS* could improve strategic decision-making.
No explicit numerical data or trends are present, but the structural differences imply methodological trade-offs in balancing exploration (e.g., MCTS*) and exploitation (e.g., SFT).