## Contour Plot: R-squared Values
### Overview
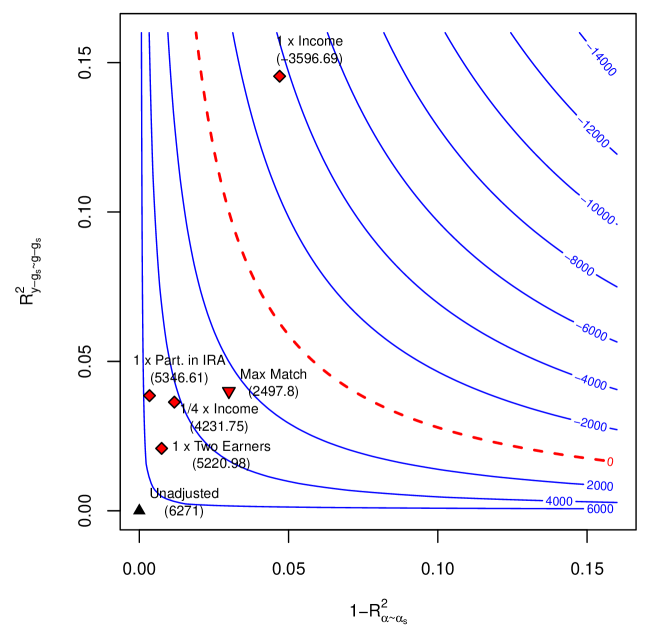
The image is a contour plot showing the relationship between two R-squared values (R²y~gs~g-gs and 1-R²α~αs) and their impact on a third, implied variable represented by the blue contour lines. Several scenarios are plotted as points on the graph, each labeled with a description and a numerical value. A red dashed line separates regions of positive and negative values.
### Components/Axes
* **X-axis:** 1-R²α~αs, ranging from 0.00 to 0.15 in increments of 0.05.
* **Y-axis:** R²y~gs~g-gs, ranging from 0.00 to 0.15 in increments of 0.05.
* **Contour Lines (Blue):** Represent constant values of the implied variable, labeled with values ranging from -14000 to 6000. The contour lines are denser towards the top-left corner of the plot.
* **Red Dashed Line:** Separates the regions of positive and negative values of the implied variable.
* **Data Points:** Represent different scenarios, each marked with a symbol and a label.
### Detailed Analysis
**Data Points:**
* **Unadjusted (Black Triangle):** Located at approximately (0.00, 0.00), value (6271).
* **1 x Two Earners (Red Diamond):** Located at approximately (0.01, 0.02), value (5220.98).
* **1/4 x Income (Red Diamond):** Located at approximately (0.02, 0.03), value (4231.75).
* **1 x Part. in IRA (Red Diamond):** Located at approximately (0.00, 0.04), value (5346.61).
* **Max Match (Red Triangle):** Located at approximately (0.04, 0.04), value (2497.8).
* **1 x Income (Red Diamond):** Located at approximately (0.04, 0.15), value (-3596.69).
**Contour Lines:**
* The blue contour lines represent values of the implied variable. From the top right to the bottom left, the values are approximately: -14000, -12000, -10000, -8000, -6000, -4000, -2000, 0, 2000, 4000, 6000.
* The contour lines are closer together in the top-left, indicating a steeper gradient in that region.
**Red Dashed Line:**
* The red dashed line separates the positive and negative regions of the implied variable. It starts near (0.00, 0.15) and curves towards (0.15, 0.00).
### Key Observations
* The "1 x Income" scenario has a negative value for the implied variable, while the other scenarios have positive values.
* The "Unadjusted" scenario has the highest positive value for the implied variable among the plotted scenarios.
* The contour lines suggest that the implied variable is highly sensitive to changes in both R-squared values in the top-left region of the plot.
### Interpretation
The contour plot visualizes the relationship between two R-squared values and their combined effect on an implied variable. The different scenarios represent various conditions or strategies, and their positions on the plot indicate their impact on the implied variable. The contour lines provide a sense of how the implied variable changes as the R-squared values vary. The red dashed line is a critical boundary, separating scenarios that result in positive or negative outcomes for the implied variable. The density of the contour lines indicates the sensitivity of the implied variable to changes in the R-squared values. The plot allows for a comparison of different scenarios and an understanding of how they affect the implied variable.