TECHNICAL ASSET FINGERPRINT
f70e7c314a7e7a55fd2f75f8
Click to view fullscreen
Press ESC or click to close
FOUND IN PAPERS
EXPERT: gemini-3.1-pro-preview VERSION 1
RUNTIME: gemini/gemini-3.1-pro-preview
INTEL_VERIFIED
## Line Charts: Explained Effect vs. Number of Edges Kept Across Four Tasks
### Overview
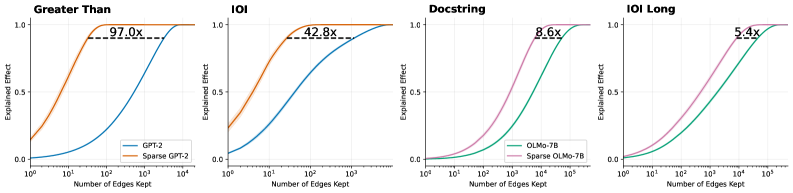
The image consists of a 1x4 grid of line charts comparing the performance of standard language models against their "Sparse" counterparts across four different tasks: "Greater Than", "IOI", "Docstring", and "IOI Long". The charts illustrate how rapidly each model achieves a high "Explained Effect" as the "Number of Edges Kept" increases. In all four panels, the sparse models achieve higher explained effects with significantly fewer edges than the standard models.
### Components/Axes
All four charts share identical axis definitions and scales:
* **Y-Axis:** Labeled "Explained Effect". The scale is linear, with major tick marks and gridlines at **0.0, 0.5, and 1.0**.
* **X-Axis:** Labeled "Number of Edges Kept". The scale is logarithmic (base 10). The range varies slightly depending on the model being evaluated:
* Charts 1 & 2 (GPT-2): Ticks at **$10^0$, $10^1$, $10^2$, $10^3$, $10^4$**.
* Charts 3 & 4 (OLMo-7B): Ticks at **$10^0$, $10^1$, $10^2$, $10^3$, $10^4$, $10^5$**.
* **Legends:**
* Located in the bottom-right corner of the first chart ("Greater Than"):
* **Blue Line:** GPT-2
* **Orange Line:** Sparse GPT-2
* *(Note: This color coding applies to the second chart, "IOI", as well).*
* Located in the bottom-right corner of the third chart ("Docstring"):
* **Green Line:** OLMo-7B
* **Pink/Purple Line:** Sparse OLMo-7B
* *(Note: This color coding applies to the fourth chart, "IOI Long", as well).*
* **Annotations:** Each chart features a horizontal dashed black line connecting the two curves at approximately the y = 0.9 level. Above this dashed line is a text label indicating a multiplier (e.g., "97.0x"), representing the ratio of edges required by the standard model versus the sparse model to achieve that specific Explained Effect.
### Detailed Analysis
#### Panel 1: Greater Than (Far Left)
* **Trend Verification:** The orange line (Sparse GPT-2) rises sharply from the y-intercept, reaching maximum effect quickly. The blue line (GPT-2) remains low initially and requires a much higher number of edges to rise.
* **Data Points (Approximate):**
* **Sparse GPT-2 (Orange):** Starts at y ~ 0.15 (x=$10^0$). Reaches y=0.5 at x ~ $10^1$. Reaches y=0.9 at x ~ 30. Reaches y=1.0 just after x=$10^2$.
* **GPT-2 (Blue):** Starts at y ~ 0.0 (x=$10^0$). Reaches y=0.5 at x ~ $10^3$. Reaches y=0.9 at x ~ 3,000. Reaches y=1.0 near x=$10^4$.
* **Annotation:** A dashed line at y ~ 0.9 connects the curves. The label reads **97.0x**, indicating GPT-2 requires 97 times more edges than Sparse GPT-2 to reach this level of explained effect.
#### Panel 2: IOI (Center Left)
* **Trend Verification:** Similar to Panel 1, the orange line (Sparse GPT-2) ascends much faster than the blue line (GPT-2).
* **Data Points (Approximate):**
* **Sparse GPT-2 (Orange):** Starts at y ~ 0.25 (x=$10^0$). Reaches y=0.5 at x ~ 5. Reaches y=0.9 at x ~ 40. Reaches y=1.0 near x=$10^2$.
* **GPT-2 (Blue):** Starts at y ~ 0.05 (x=$10^0$). Reaches y=0.5 at x ~ $10^2$. Reaches y=0.9 at x ~ 1,700. Reaches y=1.0 near x=$10^4$.
* **Annotation:** A dashed line at y ~ 0.9 connects the curves. The label reads **42.8x**.
#### Panel 3: Docstring (Center Right)
* **Trend Verification:** The pink line (Sparse OLMo-7B) rises steadily, preceding the green line (OLMo-7B), which follows a similar but delayed trajectory along the x-axis.
* **Data Points (Approximate):**
* **Sparse OLMo-7B (Pink):** Starts at y ~ 0.0 (x=$10^0$). Reaches y=0.5 at x ~ $10^3$. Reaches y=0.9 at x ~ 4,000. Reaches y=1.0 near x=$10^4$.
* **OLMo-7B (Green):** Starts at y ~ 0.0 (x=$10^0$). Reaches y=0.5 at x ~ $10^4$. Reaches y=0.9 at x ~ 35,000. Reaches y=1.0 near x=$10^5$.
* **Annotation:** A dashed line at y ~ 0.9 connects the curves. The label reads **8.6x**.
#### Panel 4: IOI Long (Far Right)
* **Trend Verification:** The pink line (Sparse OLMo-7B) rises before the green line (OLMo-7B), though the gap between them appears visually narrower than in the GPT-2 charts.
* **Data Points (Approximate):**
* **Sparse OLMo-7B (Pink):** Starts at y ~ 0.0 (x=$10^0$). Reaches y=0.5 at x ~ 500. Reaches y=0.9 at x ~ 10,000. Reaches y=1.0 near x=$10^5$.
* **OLMo-7B (Green):** Starts at y ~ 0.0 (x=$10^0$). Reaches y=0.5 at x ~ 3,000. Reaches y=0.9 at x ~ 54,000. Reaches y=1.0 slightly after the pink line.
* **Annotation:** A dashed line at y ~ 0.9 connects the curves. The label reads **5.4x**.
### Key Observations
1. **Consistent Superiority of Sparse Models:** In every task evaluated, the "Sparse" version of the model (Sparse GPT-2, Sparse OLMo-7B) achieves a high "Explained Effect" using orders of magnitude fewer "Edges" than the baseline models.
2. **Varying Efficiency Gains:** The efficiency multiplier (annotated at the ~0.9 Explained Effect mark) varies drastically depending on the model and task. The gain is massive for GPT-2 on the "Greater Than" task (97.0x) but much more modest for OLMo-7B on the "IOI Long" task (5.4x).
3. **Model Scale Differences:** The x-axis reveals that the OLMo-7B models generally require more edges overall (up to $10^5$) to reach a 1.0 explained effect compared to the GPT-2 models (which max out around $10^4$), reflecting the likely difference in the total size and complexity of the underlying models.
### Interpretation
These charts are highly indicative of research in **mechanistic interpretability** or **network pruning** within Large Language Models (LLMs).
* **"Edges Kept"** likely refers to the connections between nodes, attention heads, or MLP layers within the neural network's computational graph (often referred to as a "circuit").
* **"Explained Effect"** represents how well a sub-network (the kept edges) can replicate the performance or specific behavior of the full, unpruned model on a specific task (like "Greater Than" or "Indirect Object Identification - IOI").
**The core finding demonstrated by this data is that "Sparse" models are vastly more efficient for circuit discovery.** The data proves that by using a sparse variant of a model, researchers can isolate the specific pathways (edges) responsible for a task while throwing away the vast majority of the network. For example, in the "Greater Than" task, the sparse GPT-2 model can explain ~90% of the model's behavior using nearly 100 times fewer connections than standard GPT-2. This suggests that the sparse models have highly localized, disentangled representations for these tasks, making them significantly easier to interpret and analyze than their dense counterparts.
DECODING INTELLIGENCE...