## Comparative Analysis of Sparse vs. Dense Model Efficiency
### Overview
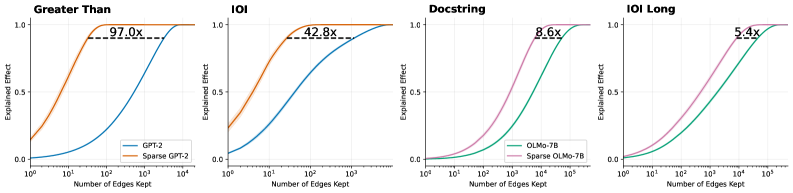
The image displays a 1x4 grid of line charts comparing the performance of standard ("dense") neural network models against their "sparse" counterparts. Each chart plots the "Explained Effect" (y-axis) against the "Number of Edges Kept" (x-axis, logarithmic scale). The central finding is that sparse models achieve the same level of explained effect with significantly fewer parameters (edges), with the efficiency gain (multiplier) varying by task.
### Components/Axes
* **Chart Type:** 4 separate line charts arranged horizontally.
* **X-Axis (All Charts):** "Number of Edges Kept". Scale is logarithmic (base 10).
* Charts 1 & 2 ("Greater Than", "IOI"): Range from 10⁰ (1) to 10⁴ (10,000).
* Charts 3 & 4 ("Docstring", "IOI Long"): Range from 10¹ (10) to 10⁵ (100,000).
* **Y-Axis (All Charts):** "Explained Effect". Linear scale from 0.0 to 1.0.
* **Legends:** Located in the bottom-right corner of each subplot.
* Chart 1: Blue line = "GPT-2", Orange line = "Sparse GPT-2"
* Chart 2: Blue line = "GPT-2", Orange line = "Sparse GPT-2"
* Chart 3: Green line = "OLMo-7B", Pink line = "Sparse OLMo-7B"
* Chart 4: Green line = "OLMo-7B", Pink line = "Sparse OLMo-7B"
* **Annotations:** Each chart contains a dashed horizontal line near the top (y ≈ 0.95-0.98) with a multiplier value (e.g., "97.0x") indicating the relative efficiency of the sparse model.
### Detailed Analysis
**Chart 1: "Greater Than"**
* **Trend Verification:** The orange "Sparse GPT-2" curve rises steeply from the left, reaching near-maximum explained effect (~0.95) at approximately 10² edges. The blue "GPT-2" curve rises much more gradually, reaching the same effect level at nearly 10⁴ edges.
* **Key Data Point/Annotation:** "97.0x". This indicates the sparse model requires roughly 97 times fewer edges to achieve the same high explained effect as the dense model on this task.
* **Spatial Grounding:** The dashed line and "97.0x" label are positioned in the upper center of the plot area.
**Chart 2: "IOI"**
* **Trend Verification:** Similar pattern to Chart 1. The orange "Sparse GPT-2" curve is significantly to the left of the blue "GPT-2" curve, indicating superior parameter efficiency.
* **Key Data Point/Annotation:** "42.8x". The efficiency gain is substantial but less extreme than for the "Greater Than" task.
* **Spatial Grounding:** Annotation is centered in the upper plot area.
**Chart 3: "Docstring"**
* **Trend Verification:** The pink "Sparse OLMo-7B" curve is to the left of the green "OLMo-7B" curve, but the gap between them is narrower than in the first two charts. Both curves have a sigmoidal shape.
* **Key Data Point/Annotation:** "8.6x". The sparse model is still more efficient, but the advantage is an order of magnitude smaller than for the GPT-2 models on the previous tasks.
* **Spatial Grounding:** Annotation is centered in the upper plot area.
**Chart 4: "IOI Long"**
* **Trend Verification:** The pink "Sparse OLMo-7B" curve is again to the left of the green "OLMo-7B" curve. The curves are closer together than in Chart 3.
* **Key Data Point/Annotation:** "5.4x". This represents the smallest efficiency multiplier among the four charts.
* **Spatial Grounding:** Annotation is centered in the upper plot area.
### Key Observations
1. **Universal Efficiency Gain:** In all four tasks, the sparse model variant achieves any given level of "Explained Effect" with fewer edges than its dense counterpart.
2. **Diminishing Multiplier:** The efficiency multiplier decreases dramatically across the charts: 97.0x → 42.8x → 8.6x → 5.4x.
3. **Task/Model Dependency:** The magnitude of the sparsification benefit is highly dependent on both the model architecture (GPT-2 vs. OLMo-7B) and the specific task ("Greater Than" vs. "IOI" vs. "Docstring" vs. "IOI Long").
4. **Curve Shape:** All curves are sigmoidal (S-shaped), indicating a phase transition where explanatory power rapidly increases after a certain threshold of edges is retained.
### Interpretation
This data provides strong empirical evidence for the **pruning hypothesis** in neural networks: that a significant portion of a model's parameters (edges) are redundant for specific tasks. The "Explained Effect" likely measures how well a subnetwork (defined by the kept edges) can replicate the full model's behavior or performance.
The key insight is that **the degree of redundancy is not constant**. The massive 97x multiplier for "Greater Than" suggests this is a relatively simple, localized computation that can be encoded in a very small sub-circuit of GPT-2. In contrast, the "IOI Long" task (likely a more complex, long-range dependency problem) shows less redundancy (5.4x), implying its solution is more distributed across the network's parameters.
The transition from GPT-2 to the larger OLMo-7B model, and from simpler to more complex tasks, shows a clear trend: **as task complexity and/or model scale increases, the relative efficiency gain from sparsification decreases, though it remains positive.** This has profound implications for model compression and efficient AI, suggesting that while pruning is universally beneficial, its most dramatic savings are found in simpler cognitive tasks or within smaller models. The consistent sigmoidal curves further suggest there exists a critical minimal subnetwork size required to solve a task, below which performance collapses.