## Line Graphs: Explained Effect vs. Number of Edges Kept
### Overview
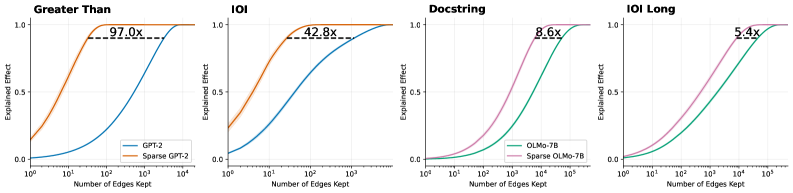
The image contains four line graphs arranged in a 2x2 grid, comparing the performance of sparse vs. non-sparse models across different tasks. Each graph plots "Explained Effect" (y-axis, 0.0–1.0) against "Number of Edges Kept" (x-axis, logarithmic scale: 10⁰ to 10⁵). The graphs are labeled "Greater Than," "IOI," "Docstring," and "IOI Long," with distinct color-coded lines for each model variant.
### Components/Axes
- **X-axis**: "Number of Edges Kept" (logarithmic scale: 10⁰, 10¹, 10², 10³, 10⁴, 10⁵).
- **Y-axis**: "Explained Effect" (linear scale: 0.0 to 1.0).
- **Legends**:
- **Top-left graphs ("Greater Than," "IOI")**:
- Blue line: "GPT-2" (non-sparse).
- Orange line: "Sparse GPT-2" (sparse).
- **Bottom-right graphs ("Docstring," "IOI Long")**:
- Teal line: "OLMo-7B" (non-sparse).
- Pink line: "Sparse OLMo-7B" (sparse).
- **Annotations**: Multipliers (e.g., "97.0x," "42.8x") indicate efficiency gains of sparse models over non-sparse baselines.
### Detailed Analysis
1. **Greater Than**
- **Sparse GPT-2 (orange)**: Rapidly plateaus near 1.0 at ~10² edges, annotated with "97.0x" efficiency gain.
- **GPT-2 (blue)**: Gradually approaches 1.0, requiring ~10³ edges.
2. **IOI**
- **Sparse GPT-2 (orange)**: Plateaus near 1.0 at ~10² edges, annotated with "42.8x" efficiency gain.
- **GPT-2 (blue)**: Reaches 1.0 at ~10³ edges.
3. **Docstring**
- **Sparse OLMo-7B (pink)**: Plateaus near 1.0 at ~10³ edges, annotated with "8.6x" efficiency gain.
- **OLMo-7B (teal)**: Reaches 1.0 at ~10⁴ edges.
4. **IOI Long**
- **Sparse OLMo-7B (pink)**: Plateaus near 1.0 at ~10⁴ edges, annotated with "5.4x" efficiency gain.
- **OLMo-7B (teal)**: Reaches 1.0 at ~10⁵ edges.
### Key Observations
- **Efficiency Gains**: Sparse models achieve near-maximum explained effect with significantly fewer edges than non-sparse models (e.g., 97.0x faster in "Greater Than").
- **Diminishing Returns**: Non-sparse models show gradual improvement, while sparse models plateau early, suggesting limited benefit from additional edges.
- **Task-Specific Performance**: Efficiency gains vary by task (e.g., "Greater Than" has the highest multiplier at 97.0x).
### Interpretation
The data demonstrates that sparse models (e.g., Sparse GPT-2, Sparse OLMo-7B) drastically reduce computational requirements while maintaining high performance, as evidenced by their early plateaus and high efficiency multipliers. This suggests sparse architectures are optimal for resource-constrained environments. The diminishing returns for non-sparse models highlight the importance of edge selection in model efficiency. The task-specific multipliers indicate that sparsity benefits vary depending on the problem domain.