\n
## Chart: Function of λ
### Overview
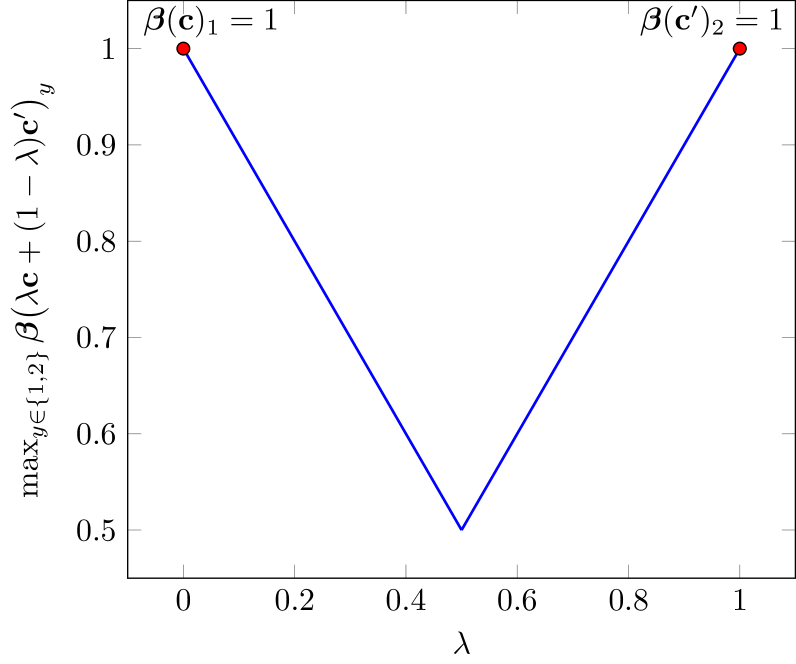
The image displays a line graph representing a function of λ (lambda). The y-axis represents `max_{y ∈ {1,2}} β(λc + (1 - λ)c')_y`, and the x-axis represents λ. The graph shows a V-shaped curve, decreasing from λ = 0 to λ = 0.4, and then increasing from λ = 0.4 to λ = 1. Two data points are explicitly marked at λ = 0 and λ = 1, both with a y-value of 1.
### Components/Axes
* **X-axis:** λ (lambda), ranging from approximately 0 to 1.
* **Y-axis:** `max_{y ∈ {1,2}} β(λc + (1 - λ)c')_y`, ranging from approximately 0.5 to 1.
* **Line:** A single blue line representing the function.
* **Data Points:** Two red circular data points are marked.
* **Annotations:**
* "β(c)₁ = 1" positioned above the data point at λ = 0.
* "β(c')₂ = 1" positioned above the data point at λ = 1.
### Detailed Analysis
The blue line starts at approximately (0, 1), slopes downward linearly, reaches a minimum at approximately (0.4, 0.5), and then slopes upward linearly to approximately (1, 1).
* **λ = 0:** y ≈ 1
* **λ = 0.2:** y ≈ 0.85
* **λ = 0.4:** y ≈ 0.5
* **λ = 0.6:** y ≈ 0.65
* **λ = 0.8:** y ≈ 0.85
* **λ = 1:** y ≈ 1
### Key Observations
The function is symmetric around λ = 0.5. The minimum value of the function is approximately 0.5, occurring at λ = 0.4. The function's value is 1 at both ends of the plotted range (λ = 0 and λ = 1).
### Interpretation
The graph likely represents a mixing or interpolation function. The parameter λ controls the weighting between two components, 'c' and 'c''. The function `β` appears to be a measure of some property associated with these components. The `max` function indicates that the value being plotted is the maximum value of `β` across two possible outcomes (y = 1 and y = 2).
The V-shape suggests that as λ moves away from 0 or 1, the maximum value of `β` decreases, reaching a minimum when λ = 0.4. This could indicate that the optimal mix between 'c' and 'c'' occurs when λ is around 0.4, resulting in the lowest value of the measured property `β`. The annotations suggest that β(c)₁ = 1 and β(c')₂ = 1, meaning that the property β has a value of 1 when applied to component 'c' with outcome 1, and to component 'c'' with outcome 2.
The graph demonstrates a trade-off or compromise between the two components 'c' and 'c''. When λ is close to 0, the function is dominated by 'c', and when λ is close to 1, it is dominated by 'c''. The minimum value at λ = 0.4 suggests that a balanced combination of 'c' and 'c'' yields the least desirable outcome (as measured by β).