## Line Graph: Trade-off between Parameters c and c'
### Overview
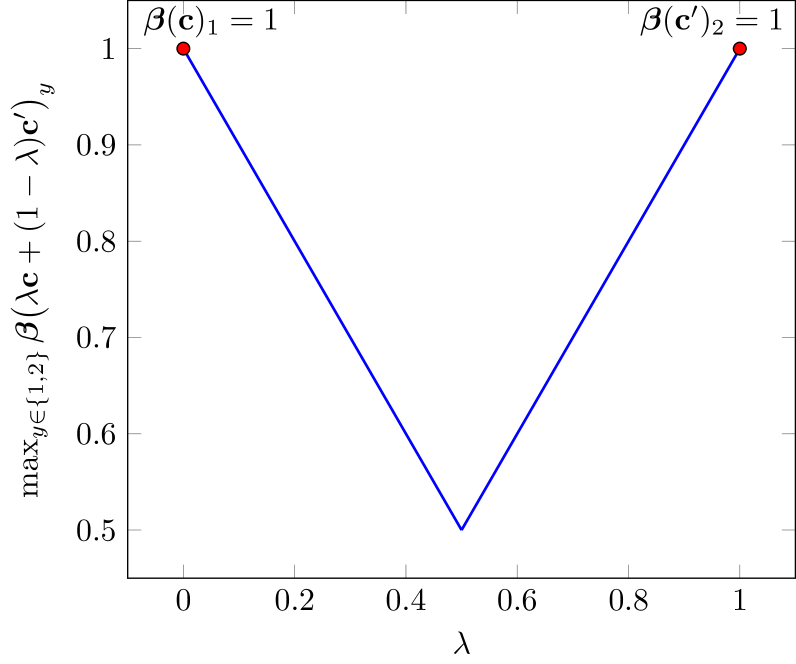
The image depicts a V-shaped line graph illustrating the relationship between a parameter λ (ranging from 0 to 1) and the maximum value of a function β(λc + (1−λ)c')_y for y ∈ {1,2}. The graph includes two red data points at λ=0 and λ=1, both with y=1, and a minimum at λ=0.5 with y=0.5.
### Components/Axes
- **X-axis (λ)**: Labeled "λ", scaled from 0 to 1 in increments of 0.2.
- **Y-axis**: Labeled "max_{y∈{1,2}} β(λc + (1−λ)c')_y", scaled from 0.5 to 1 in increments of 0.1.
- **Legend**: Located at the top-right, with two entries:
- β(c')₁ = 1 (red)
- β(c')₂ = 1 (red)
- **Data Points**:
- Red dot at (λ=0, y=1)
- Red dot at (λ=1, y=1)
### Detailed Analysis
- **Line Behavior**:
- The line starts at (0,1), decreases linearly to a minimum at (0.5, 0.5), then increases linearly back to (1,1).
- The slope is -1 from λ=0 to λ=0.5 and +1 from λ=0.5 to λ=1.
- **Data Points**:
- Both endpoints (λ=0 and λ=1) are marked with red dots, corresponding to the legend labels β(c')₁ and β(c')₂.
- The minimum value at λ=0.5 is not explicitly labeled but inferred from the graph's shape.
### Key Observations
1. **Symmetry**: The graph is symmetric around λ=0.5, suggesting equal influence of parameters c and c' at this midpoint.
2. **Maximum Values**: The maximum β value (1) occurs at the extremes (λ=0 and λ=1), indicating optimal performance when fully favoring one parameter over the other.
3. **Minimum Value**: The lowest β value (0.5) at λ=0.5 suggests a trade-off penalty when balancing both parameters equally.
### Interpretation
The graph demonstrates a trade-off between two competing parameters, c and c', where β represents a performance metric. The V-shape implies that extreme specialization (λ=0 or λ=1) maximizes performance, while equal weighting (λ=0.5) minimizes it. This could reflect scenarios like resource allocation, risk management, or optimization problems where over-diversification reduces efficiency. The red dots at the endpoints emphasize the criticality of these extremes in the system's behavior.