## Bar Chart: Number of Solved Tasks
### Overview
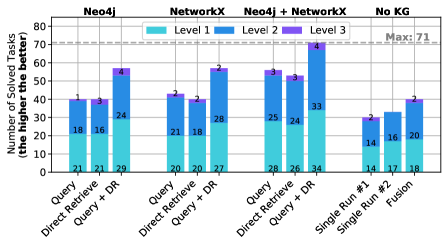
The image is a bar chart comparing the number of solved tasks across different configurations (Neo4j, NetworkX, Neo4j + NetworkX, and No KG) and task types (Query, Direct Retrieve, Query + DR, Single Run #1, Single Run #2, Fusion). The chart displays the number of solved tasks, broken down into three levels (Level 1, Level 2, and Level 3).
### Components/Axes
* **Title:** Number of Solved Tasks (the higher the better)
* **Y-axis:** Number of Solved Tasks (the higher the better), ranging from 0 to 80.
* **X-axis:** Task types: Query, Direct Retrieve, Query + DR, Single Run #1, Single Run #2, Fusion. These are grouped under the configurations Neo4j, NetworkX, Neo4j + NetworkX, and No KG.
* **Legend:** Located at the top of the chart.
* Level 1: Light Blue
* Level 2: Blue
* Level 3: Purple
* **Horizontal Dashed Line:** At y=71, labeled "Max: 71"
### Detailed Analysis
**Neo4j**
* **Query:**
* Level 1: 21
* Level 2: 18
* Level 3: 1
* **Direct Retrieve:**
* Level 1: 21
* Level 2: 16
* Level 3: 3
* **Query + DR:**
* Level 1: 29
* Level 2: 24
* Level 3: 4
**NetworkX**
* **Query:**
* Level 1: 20
* Level 2: 21
* Level 3: 2
* **Direct Retrieve:**
* Level 1: 20
* Level 2: 18
* Level 3: 2
* **Query + DR:**
* Level 1: 27
* Level 2: 28
* Level 3: 2
**Neo4j + NetworkX**
* **Query:**
* Level 1: 28
* Level 2: 25
* Level 3: 3
* **Direct Retrieve:**
* Level 1: 26
* Level 2: 24
* Level 3: 3
* **Query + DR:**
* Level 1: 34
* Level 2: 33
* Level 3: 4
**No KG**
* **Single Run #1:**
* Level 1: 14
* Level 2: 14
* Level 3: 2
* **Single Run #2:**
* Level 1: 17
* Level 2: 16
* Level 3: 2
* **Fusion:**
* Level 1: 18
* Level 2: 20
* Level 3: 2
### Key Observations
* The "Query + DR" task in the "Neo4j + NetworkX" configuration achieves the highest number of solved tasks.
* The "No KG" configuration generally has lower numbers of solved tasks compared to the other configurations.
* Level 1 and Level 2 contribute the most to the total number of solved tasks, with Level 3 contributing the least.
### Interpretation
The chart demonstrates the performance of different knowledge graph systems (Neo4j, NetworkX, and their combination) on various tasks. The "Neo4j + NetworkX" configuration appears to be the most effective, particularly for the "Query + DR" task. The "No KG" configuration serves as a baseline, showing the performance without a knowledge graph. The breakdown into levels could represent different difficulty levels or types of tasks, with Level 1 and Level 2 being more frequently solved than Level 3. The horizontal line at 71 indicates a maximum possible score, suggesting that the "Neo4j + NetworkX" configuration is approaching the optimal performance for the "Query + DR" task.