\n
## Bar Chart: Performance Comparison of Knowledge Graph Systems
### Overview
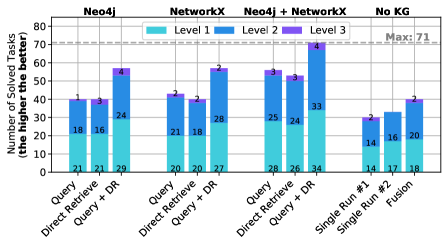
This bar chart compares the performance of different knowledge graph systems (Neo4j, NetworkX, and combinations thereof) across various approaches (Direct Retrieve, Query, Query + DR) and levels of task complexity (Level 1, Level 2, Level 3). The performance metric is the "Number of Solved Tasks," where a higher number indicates better performance. A "Max" value is also indicated.
### Components/Axes
* **X-axis:** Represents the different system configurations and approaches. Categories are: "Direct Retrieve", "Query", "Query + DR", "Single Run #1", "Single Run #2", "Fusion". These are further grouped under "Neo4j", "NetworkX", "Neo4j + NetworkX", and "No KG".
* **Y-axis:** Represents the "Number of Solved Tasks" with a scale from 0 to 80. The label also states "(the higher the better)".
* **Legend:**
* Level 1: Light Blue
* Level 2: Medium Blue
* Level 3: Purple
* Max: Grey
* **Title:** Not explicitly present, but the chart's content implies a title related to performance comparison.
### Detailed Analysis
The chart consists of grouped bar plots for each system configuration. Each group has three bars representing Level 1, Level 2, and Level 3 tasks, plus a grey "Max" bar.
**Neo4j:**
* **Direct Retrieve:** Level 1: ~21, Level 2: ~18, Level 3: ~16
* **Query:** Level 1: ~40, Level 2: ~21, Level 3: ~21
* **Query + DR:** Level 1: ~24, Level 2: ~29, Level 3: ~42
**NetworkX:**
* **Direct Retrieve:** Level 1: ~20, Level 2: ~20, Level 3: ~18
* **Query:** Level 1: ~28, Level 2: ~21, Level 3: ~28
* **Query + DR:** Level 1: ~60, Level 2: ~34, Level 3: ~2
**Neo4j + NetworkX:**
* **Direct Retrieve:** Level 1: ~25, Level 2: ~26, Level 3: ~24
* **Query:** Level 1: ~54, Level 2: ~33, Level 3: ~3
* **Query + DR:** Level 1: ~72, Level 2: ~33, Level 3: ~5
**No KG:**
* **Single Run #1:** Level 1: ~14, Level 2: ~14, Level 3: ~2
* **Single Run #2:** Level 1: ~20, Level 2: ~16, Level 3: ~18
* **Fusion:** Level 1: ~32, Level 2: ~42, Level 3: ~38
### Key Observations
* The "Query + DR" approach generally performs best for Neo4j and Neo4j + NetworkX, especially at Level 1.
* NetworkX shows a significant performance boost with the "Query + DR" approach at Level 1, outperforming Neo4j and Neo4j + NetworkX.
* Level 3 tasks consistently have the lowest solved counts across all configurations.
* The "Max" value is relatively low across all configurations, suggesting a ceiling on performance.
* The "Fusion" approach in the "No KG" category shows the highest performance among the "No KG" configurations.
### Interpretation
The chart demonstrates the effectiveness of combining query-based and direct retrieval approaches for knowledge graph systems. The "Query + DR" strategy appears to leverage the strengths of both methods, leading to improved performance, particularly for Level 1 tasks. The performance differences between Neo4j, NetworkX, and their combination suggest that each system has unique capabilities and limitations. The consistently low performance on Level 3 tasks indicates that these tasks are inherently more challenging or require more sophisticated reasoning capabilities than the systems currently possess. The "Max" value suggests that there is a limit to the number of tasks that can be solved, even with the best configuration. The "No KG" category provides a baseline for comparison, and the "Fusion" approach shows that even without a dedicated knowledge graph, reasonable performance can be achieved through alternative methods. The chart highlights the importance of selecting the appropriate system configuration and approach based on the specific task complexity and desired performance level.