## Diagram: Feynman Diagram Transformation
### Overview
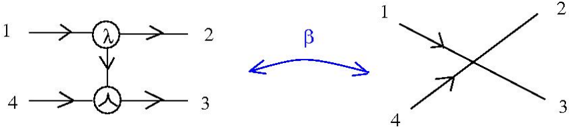
The image depicts a transformation between two Feynman diagrams, connected by a blue double-headed arrow labeled "β". The diagram on the left represents an interaction mediated by two vertices, each labeled with "λ". The diagram on the right represents a direct interaction.
### Components/Axes
* **Diagram 1 (Left):**
* External lines labeled 1, 2, 3, and 4.
* Arrows on lines indicate direction. Lines 1 and 4 are incoming, lines 2 and 3 are outgoing.
* Two vertices, each enclosed in a circle. The top vertex contains the symbol "λ", and the bottom vertex contains the symbol "Λ".
* An internal line connects the two vertices, with an arrow indicating direction from the top vertex to the bottom vertex.
* **Diagram 2 (Right):**
* External lines labeled 1, 2, 3, and 4.
* Arrows on lines indicate direction. Lines 1 and 4 are incoming, lines 2 and 3 are outgoing.
* A single vertex where all four lines intersect.
* **Transformation Arrow:**
* A blue double-headed arrow connects the two diagrams, indicating a transformation or equivalence.
* The arrow is labeled "β" above it.
### Detailed Analysis or ### Content Details
* **Diagram 1:**
* Line 1 enters from the left and connects to the top vertex.
* Line 2 exits to the right from the top vertex.
* Line 4 enters from the left and connects to the bottom vertex.
* Line 3 exits to the right from the bottom vertex.
* The internal line connects the top vertex to the bottom vertex.
* **Diagram 2:**
* Line 1 enters from the top-left and connects to the central vertex.
* Line 2 exits to the top-right from the central vertex.
* Line 4 enters from the bottom-left and connects to the central vertex.
* Line 3 exits to the bottom-right from the central vertex.
* Lines 1 and 3 cross over each other.
* Lines 2 and 4 cross over each other.
### Key Observations
* The transformation relates a two-vertex interaction to a single-vertex interaction.
* The parameter "β" likely represents a coupling constant or a transformation parameter.
* The symbols "λ" and "Λ" at the vertices in the first diagram likely represent coupling strengths.
### Interpretation
The image illustrates a possible transformation between two different representations of a physical process. The diagram on the left represents a process mediated by an intermediate state, while the diagram on the right represents a direct interaction. The parameter "β" likely governs the strength or probability of this transformation. This type of transformation is common in quantum field theory, where different diagrams can represent the same physical process at different levels of approximation. The presence of "λ" and "Λ" suggests that the strength of the interaction at each vertex is important for understanding the overall process.