\n
## Diagram: Bifurcation Diagram
### Overview
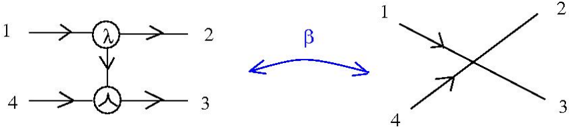
The image presents two diagrams illustrating a bifurcation process. The left diagram depicts a branching structure with labeled nodes and arrows, while the right diagram shows a simplified crossing of lines representing the same process. A bidirectional arrow labeled "β" connects the two diagrams.
### Components/Axes
The diagrams utilize the following components:
* **Nodes:** Circular nodes with internal patterns (circles within circles).
* **Arrows:** Arrows indicating flow or connection between nodes/lines.
* **Labels:** Numbers 1 through 4 labeling the input/output points.
* **Label:** "λ" inside the top circular node.
* **Label:** "β" labeling the bidirectional arrow.
### Detailed Analysis or Content Details
**Left Diagram:**
* Input 1 splits into two outputs: 2 and a connection to the lower node.
* Input 4 splits into two outputs: 3 and a connection to the lower node.
* The lower node has a pattern of nested circles.
* The label "λ" is positioned inside the top circular node.
**Right Diagram:**
* Line originating from point 1 crosses with a line originating from point 4.
* The crossing creates two output lines, one leading to point 2 and the other to point 3.
* Arrows indicate the direction of flow along each line.
**Bidirectional Arrow:**
* The arrow labeled "β" connects the two diagrams, indicating a relationship or transformation between them. The arrow has two heads, indicating the relationship is bidirectional.
### Key Observations
* The left diagram is a more detailed representation of the branching process, while the right diagram is a simplified schematic.
* The label "λ" might represent a parameter or condition influencing the branching.
* The label "β" likely represents a transformation or relationship between the detailed and simplified representations of the bifurcation.
* The diagrams do not contain numerical data or scales.
### Interpretation
The diagrams illustrate a bifurcation, a point where a system's behavior splits into two or more possibilities. The left diagram shows a more complex branching structure, potentially representing a detailed model of the bifurcation process. The right diagram provides a simplified, schematic view of the same process, focusing on the crossing of paths. The "λ" label likely represents a control parameter that influences the branching, while "β" represents the transformation or mapping between the detailed and simplified representations. The bidirectional arrow suggests that the simplified model can be used to understand the detailed model, and vice versa. This type of diagram is common in dynamical systems theory, particularly when analyzing how systems change their behavior as parameters are varied. The absence of numerical data suggests the diagrams are conceptual rather than quantitative.