## Bar Charts: Top Original vs. Top Imputed Vartags
### Overview
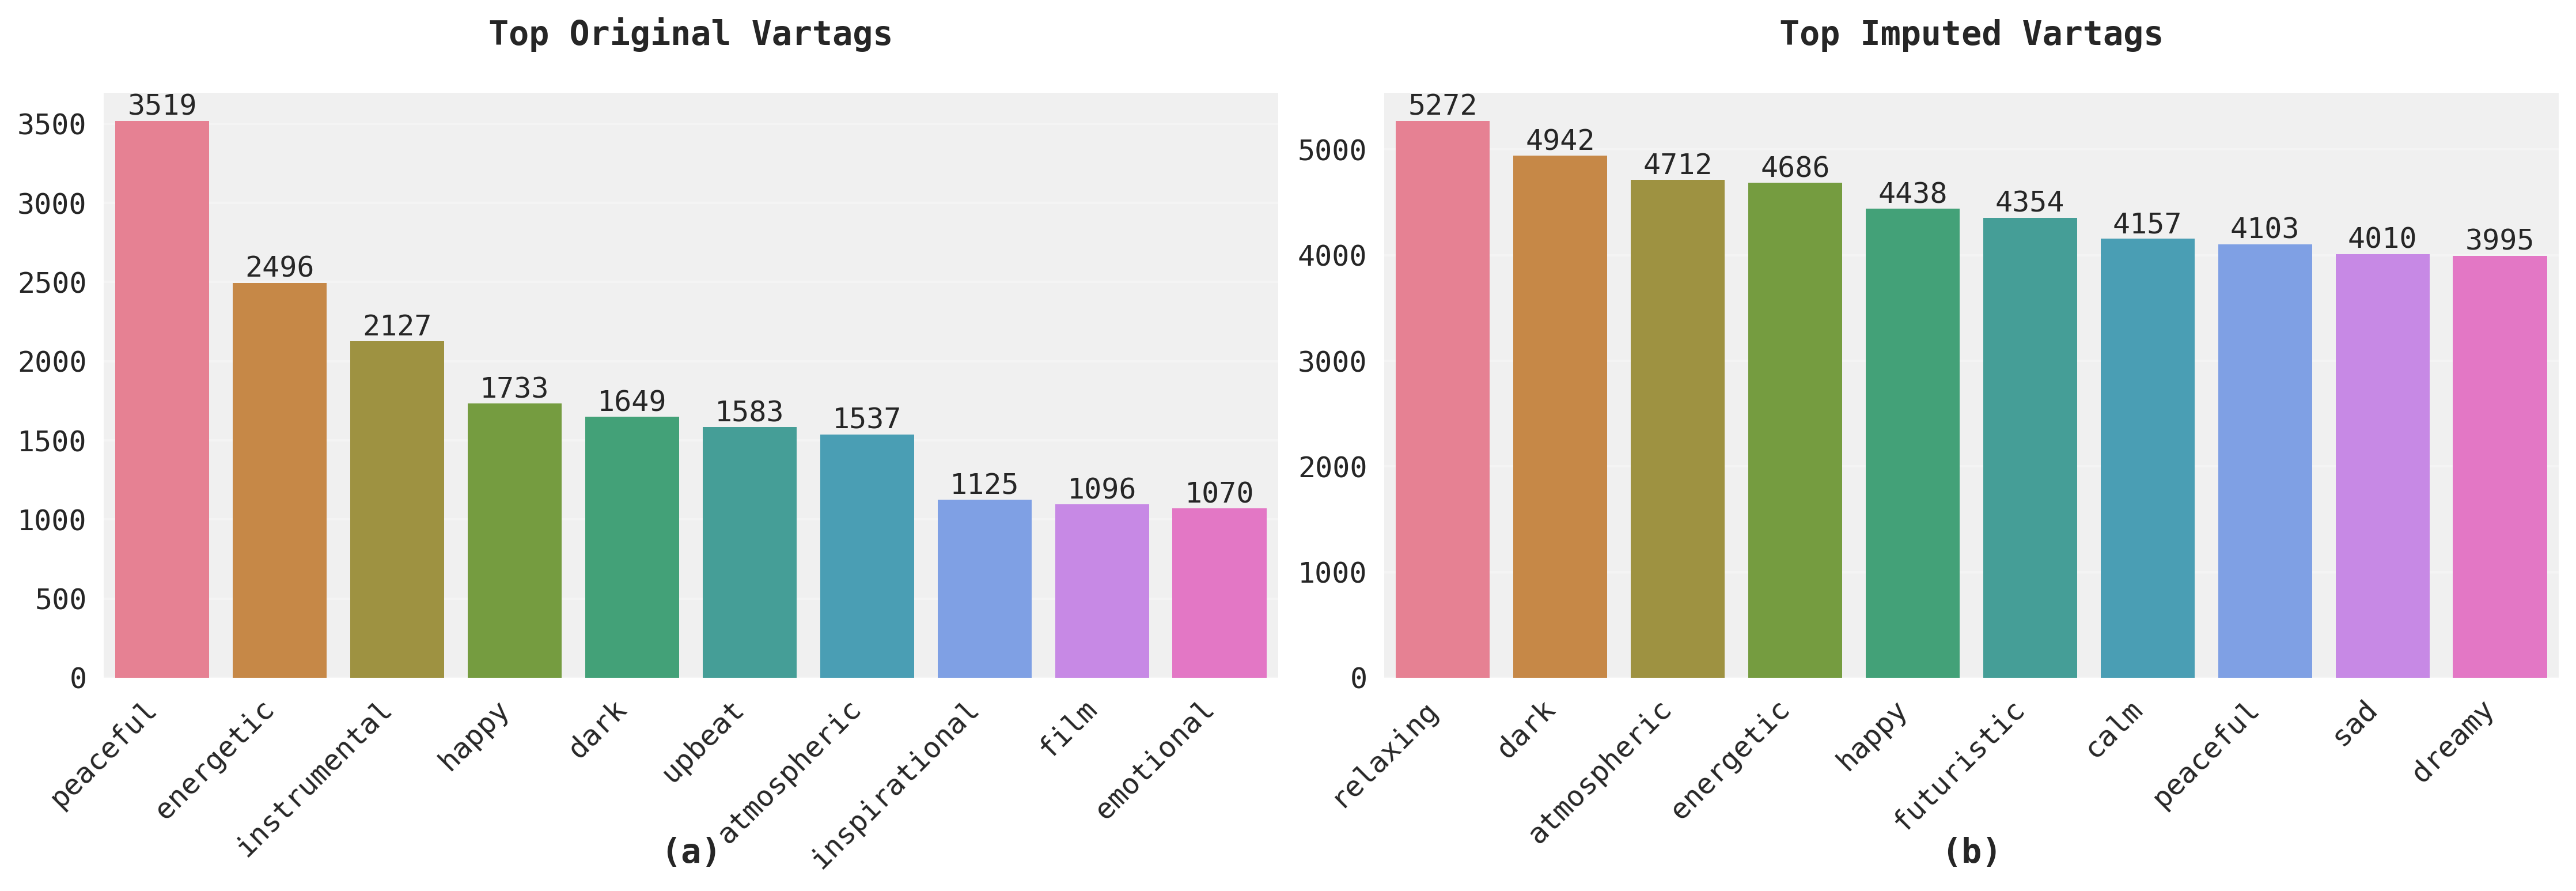
The image contains two side-by-side bar charts comparing "Top Original Vartags" (left) and "Top Imputed Vartags" (right). Both charts display categorical data with numerical values, using distinct color-coded bars for each category. The original chart focuses on emotional/psychological states, while the imputed chart emphasizes mood and atmospheric themes.
### Components/Axes
#### Left Chart (Top Original Vartags)
- **X-axis**: Categories (emotional/psychological states)
- peaceful, energetic, instrumental, happy, dark, upbeat, atmospheric, inspirational, film, emotional
- **Y-axis**: Numerical values (0–3,500)
- **Legend**: Color-coded categories (pink, orange, green, teal, blue, purple)
- **Bar Colors**:
- peaceful (pink), energetic (orange), instrumental (green), happy (green), dark (teal), upbeat (teal), atmospheric (blue), inspirational (blue), film (purple), emotional (purple)
#### Right Chart (Top Imputed Vartags)
- **X-axis**: Categories (mood/atmospheric themes)
- relaxing, dark, atmospheric, energetic, happy, futuristic, calm, peaceful, sad, dreamy
- **Y-axis**: Numerical values (0–5,000)
- **Legend**: Color-coded categories (pink, orange, green, brown, teal, blue, purple)
- **Bar Colors**:
- relaxing (pink), dark (orange), atmospheric (green), energetic (brown), happy (green), futuristic (teal), calm (blue), peaceful (light blue), sad (purple), dreamy (pink)
### Detailed Analysis
#### Left Chart (Top Original Vartags)
- **Highest Value**: "peaceful" (3,519, pink)
- **Lowest Value**: "emotional" (1,070, purple)
- **Trend**: Values decrease from left to right, with a sharp drop after "dark" (1,649) to "atmospheric" (1,583) and further declines to "inspirational" (1,125) and "film" (1,096).
#### Right Chart (Top Imputed Vartags)
- **Highest Value**: "relaxing" (5,272, pink)
- **Lowest Value**: "dreamy" (3,995, pink)
- **Trend**: Values decrease from left to right, with a gradual decline from "dark" (4,942) to "dreamy" (3,995). "Calm" (4,157) and "peaceful" (4,103) show near-identical values.
### Key Observations
1. **Value Discrepancies**:
- Imputed values are consistently higher than original values for overlapping categories (e.g., "dark" increases from 1,649 to 4,942; "happy" from 1,733 to 4,686).
- "Peaceful" appears in both charts but with vastly different values (3,519 vs. 4,103).
2. **Category Overlap**:
- "Dark," "happy," and "peaceful" appear in both charts but with divergent values.
- Unique categories: "instrumental," "upbeat," "inspirational," "film," "emotional" (original); "relaxing," "atmospheric," "energetic," "futuristic," "calm," "sad," "dreamy" (imputed).
3. **Color Consistency**:
- "Dark" (teal in original, orange in imputed) and "happy" (green in both) retain consistent colors across charts.
- "Peaceful" shifts from pink (original) to light blue (imputed), suggesting distinct categorization.
### Interpretation
The data suggests that the imputation process significantly alters the distribution and magnitude of Vartag values. Imputed categories like "relaxing" and "dark" dominate with higher values, potentially indicating that the imputation method prioritizes these themes or fills missing data with estimates skewed toward these categories. The original chart’s lower values and narrower category range imply that the original dataset may have been more limited in scope or resolution. The divergence in "peaceful" values (3,519 vs. 4,103) highlights inconsistencies between original and imputed data, raising questions about the imputation algorithm’s reliability or the original data’s completeness. The overlapping categories with divergent values (e.g., "dark," "happy") suggest that imputation may introduce biases or amplify certain themes, warranting further investigation into the methodology’s impact on data integrity.