## Technical Description of the Bar Chart
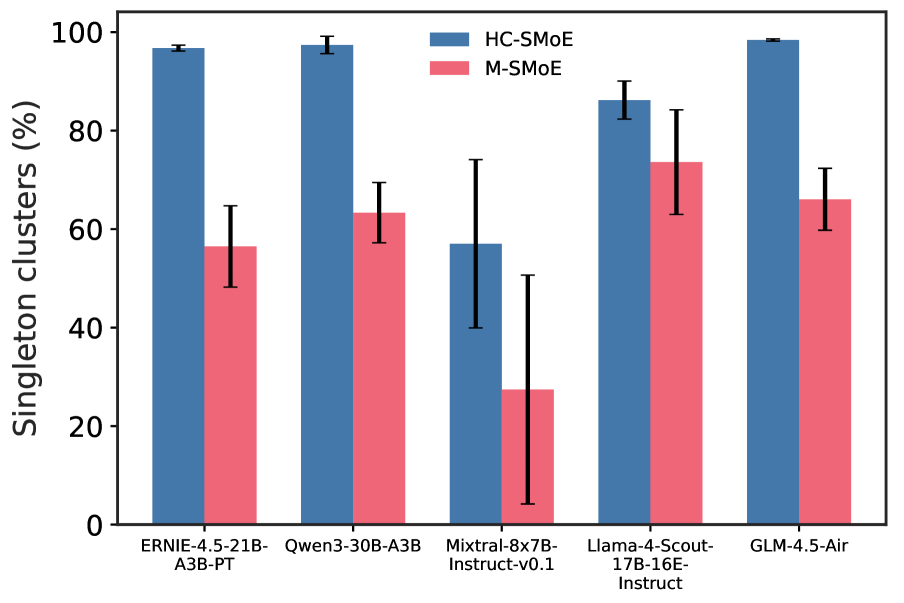
This image is a grouped bar chart comparing the percentage of "Singleton clusters" for two different methods, "HC-SMoE" and "M-SMoE", across five different language models. The chart includes error bars for each data point.
### Chart Components
* **Y-axis:** The vertical axis is labeled "Singleton clusters (%)" and ranges from 0 to 100, with major tick marks at 0, 20, 40, 60, 80, and 100.
* **X-axis:** The horizontal axis represents five different language models, labeled as follows:
* ERNIE-4.5-21B-A3B-PT
* Qwen3-30B-A3B
* Mixtral-8x7B-Instruct-v0.1
* Llama-4-Scout-17B-16E-Instruct
* GLM-4.5-Air
* **Legend:** A legend is located in the upper right area of the chart, indicating the color coding for the two methods:
* **Blue:** HC-SMoE
* **Red/Pink:** M-SMoE
### Data Analysis
The chart presents the following data for each model, with estimated values and error ranges:
1. **ERNIE-4.5-21B-A3B-PT:**
* **HC-SMoE (Blue):** The bar reaches approximately 97%. The error bar is very small, indicating a tight range around this value.
* **M-SMoE (Red):** The bar reaches approximately 56%. The error bar extends from about 48% to 64%.
2. **Qwen3-30B-A3B:**
* **HC-SMoE (Blue):** The bar reaches approximately 98%. The error bar is very small.
* **M-SMoE (Red):** The bar reaches approximately 63%. The error bar extends from about 57% to 69%.
3. **Mixtral-8x7B-Instruct-v0.1:**
* **HC-SMoE (Blue):** The bar reaches approximately 57%. The error bar extends from about 40% to 74%.
* **M-SMoE (Red):** The bar reaches approximately 27%. The error bar extends from about 4% to 50%.
4. **Llama-4-Scout-17B-16E-Instruct:**
* **HC-SMoE (Blue):** The bar reaches approximately 86%. The error bar extends from about 82% to 90%.
* **M-SMoE (Red):** The bar reaches approximately 73%. The error bar extends from about 63% to 83%.
5. **GLM-4.5-Air:**
* **HC-SMoE (Blue):** The bar reaches approximately 99%. The error bar is very small.
* **M-SMoE (Red):** The bar reaches approximately 66%. The error bar extends from about 60% to 72%.
### Key Trends
* Across all five models, the **HC-SMoE** method consistently results in a higher percentage of singleton clusters compared to the **M-SMoE** method.
* The difference between the two methods is most pronounced for **Mixtral-8x7B-Instruct-v0.1** and **ERNIE-4.5-21B-A3B-PT**.
* The **HC-SMoE** method generally shows smaller error bars, suggesting more consistent results, except for the **Mixtral-8x7B-Instruct-v0.1** model.
* The **M-SMoE** method exhibits larger error bars across most models, particularly for **Mixtral-8x7B-Instruct-v0.1**.