# Technical Document Extraction: Bar Chart Analysis
## Chart Type
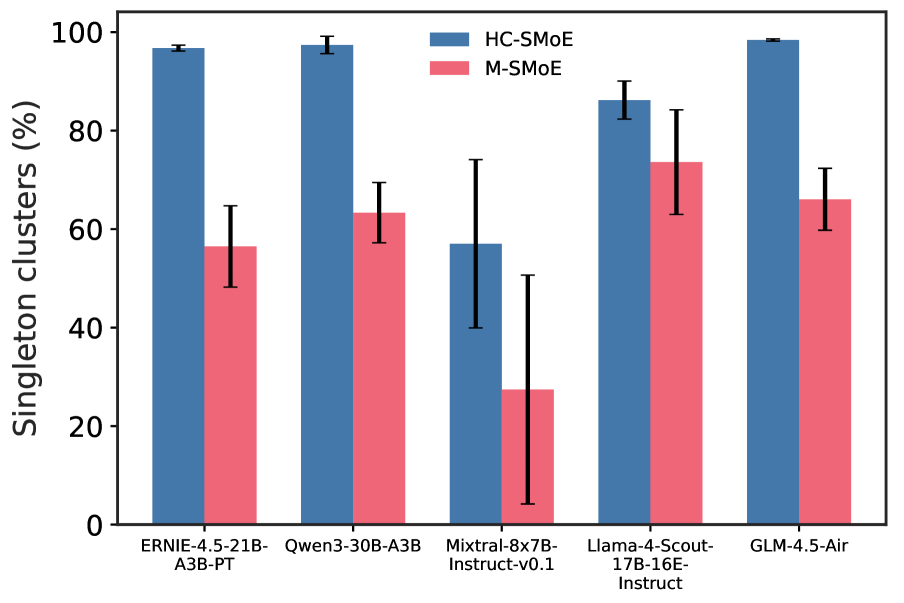
- **Bar Chart** comparing performance metrics across different models.
## Axes
- **X-Axis (Categories)**:
- ERNIE-4.5-21B-A3B-PT
- Qwen3-30B-A3B
- Mixtral-8x7B-Instruct-v0.1
- Llama-4-Scout-17B-16E-Instruct
- GLM-4.5-Air
- **Y-Axis (Values)**:
- **Title**: "Singleton clusters (%)"
- **Range**: 0% to 100% (increments of 20%)
## Legend
- **HC-SMoE**: Blue bars
- **M-SMoE**: Red bars
## Data Points
1. **ERNIE-4.5-21B-A3B-PT**
- HC-SMoE: ~98% (error bar: ±2%)
- M-SMoE: ~58% (error bar: ±6%)
2. **Qwen3-30B-A3B**
- HC-SMoE: ~98% (error bar: ±2%)
- M-SMoE: ~63% (error bar: ±5%)
3. **Mixtral-8x7B-Instruct-v0.1**
- HC-SMoE: ~58% (error bar: ±7%)
- M-SMoE: ~28% (error bar: ±10%)
4. **Llama-4-Scout-17B-16E-Instruct**
- HC-SMoE: ~86% (error bar: ±4%)
- M-SMoE: ~74% (error bar: ±6%)
5. **GLM-4.5-Air**
- HC-SMoE: ~99% (error bar: ±1%)
- M-SMoE: ~66% (error bar: ±5%)
## Key Trends
- **HC-SMoE** consistently outperforms **M-SMoE** across all models.
- **Highest Performance**:
- HC-SMoE: GLM-4.5-Air (~99%)
- M-SMoE: Llama-4-Scout-17B-16E-Instruct (~74%)
- **Lowest Performance**:
- HC-SMoE: Mixtral-8x7B-Instruct-v0.1 (~58%)
- M-SMoE: Mixtral-8x7B-Instruct-v0.1 (~28%)
- **Error Bar Observations**:
- Larger variability in M-SMoE results (e.g., ±10% for Mixtral-8x7B-Instruct-v0.1).
- Smaller error margins for HC-SMoE in most cases.
## Notes
- Error bars represent standard deviation or confidence intervals (exact methodology unspecified).
- No numerical values explicitly labeled on bars; percentages estimated visually.