## Diagram: Image Processing Flow
### Overview
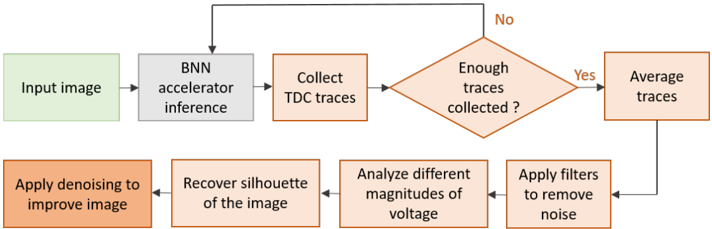
The image is a flowchart illustrating an image processing pipeline. It starts with an input image, proceeds through several processing steps, and includes a feedback loop based on a condition.
### Components/Axes
The diagram consists of rectangular and diamond-shaped blocks representing different stages of image processing. Arrows indicate the flow of data between these stages. The blocks are colored differently to distinguish between different types of operations.
* **Input Image:** Green rectangle labeled "Input image".
* **BNN Accelerator Inference:** Gray rectangle labeled "BNN accelerator inference".
* **Collect TDC Traces:** Orange rectangle labeled "Collect TDC traces".
* **Enough Traces Collected?:** Orange diamond labeled "Enough traces collected?". This is a decision point.
* **Average Traces:** Orange rectangle labeled "Average traces".
* **Apply Filters to Remove Noise:** Orange rectangle labeled "Apply filters to remove noise".
* **Analyze Different Magnitudes of Voltage:** Orange rectangle labeled "Analyze different magnitudes of voltage".
* **Recover Silhouette of the Image:** Orange rectangle labeled "Recover silhouette of the image".
* **Apply Denoising to Improve Image:** Orange rectangle labeled "Apply denoising to improve image".
* **Arrows:** Black arrows indicate the direction of data flow.
* **Decision Labels:** "Yes" and "No" labels indicate the outcome of the decision point.
### Detailed Analysis
1. **Initial Stage:** The process begins with an "Input image" (green).
2. **BNN Inference:** The image then goes through "BNN accelerator inference" (gray).
3. **TDC Trace Collection:** Next, "Collect TDC traces" (orange).
4. **Decision Point:** A diamond shape asks "Enough traces collected?" (orange).
* If the answer is "Yes", the process moves to "Average traces" (orange).
* If the answer is "No", the process loops back to "Collect TDC traces" (orange).
5. **Averaging and Filtering:** After averaging, the process moves to "Apply filters to remove noise" (orange).
6. **Voltage Analysis:** The filtered data is then used to "Analyze different magnitudes of voltage" (orange).
7. **Silhouette Recovery:** The analysis leads to "Recover silhouette of the image" (orange).
8. **Denoising:** Finally, "Apply denoising to improve image" (orange).
9. **Feedback Loop:** The denoised image is fed back into the "Average traces" block.
### Key Observations
* The flowchart describes a cyclical process with a decision point that determines whether to continue collecting data or proceed with further processing.
* The color coding may indicate different types of operations (e.g., green for input, gray for inference, orange for data processing).
* The feedback loop suggests an iterative refinement of the image.
### Interpretation
The diagram illustrates an image processing pipeline that uses BNN (Binary Neural Network) acceleration and TDC (Time-to-Digital Converter) traces. The process involves collecting data, making a decision about data sufficiency, averaging, filtering, analyzing voltage magnitudes, recovering the silhouette, and denoising the image. The feedback loop suggests that the process is iterative, with the denoised image being used to refine the subsequent averaging and filtering steps. This iterative approach likely aims to improve the quality and accuracy of the final image. The use of BNN acceleration suggests a focus on efficient and potentially low-power image processing.