\n
## Diagram: Image Processing and Analysis Flowchart
### Overview
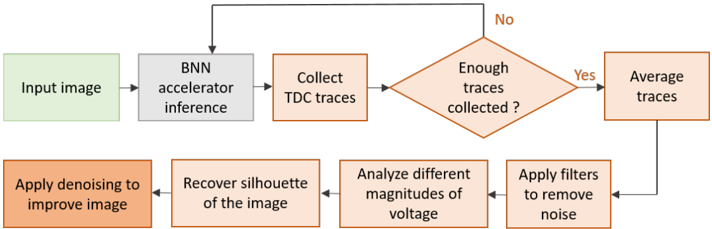
This diagram illustrates a flowchart detailing the process of image analysis, starting from an input image and culminating in averaged traces. The process involves a feedback loop for trace collection and image improvement.
### Components/Axes
The diagram consists of rectangular blocks representing processing steps, connected by arrows indicating the flow of data. A diamond shape represents a decision point. The key components are:
* **Input image:** The starting point of the process.
* **BNN accelerator inference:** A processing step utilizing a Binary Neural Network (BNN) accelerator.
* **Collect TDC traces:** A step involving the collection of Time-to-Digital Converter (TDC) traces.
* **Enough traces collected?:** A decision point determining whether sufficient traces have been gathered.
* **Average traces:** A step where collected traces are averaged.
* **Apply denoising to improve image:** A step to reduce noise in the image.
* **Recover silhouette of the image:** A step to extract the image's outline.
* **Analyze different magnitudes of voltage:** A step to analyze voltage variations.
* **Apply filters to remove noise:** A step to further reduce noise.
The arrows indicate the direction of the process flow. The "No" branch from the decision point loops back to "Collect TDC traces", while the "Yes" branch leads to "Average traces". The "Average traces" block then feeds back into "Apply denoising to improve image".
### Detailed Analysis or Content Details
The process begins with an "Input image" (top-left). This image is then processed by a "BNN accelerator inference" block (center-left). The output of this block is used to "Collect TDC traces" (center). A decision is made: "Enough traces collected?". If the answer is "No", the process loops back to "Collect TDC traces". If the answer is "Yes", the process proceeds to "Average traces" (top-right).
The "Average traces" block then feeds into a series of image improvement steps: "Apply denoising to improve image" (bottom-left), "Recover silhouette of the image" (bottom-center-left), "Analyze different magnitudes of voltage" (bottom-center), and "Apply filters to remove noise" (bottom-right). These steps then loop back to the "BNN accelerator inference" block, creating a feedback loop.
### Key Observations
The diagram highlights a cyclical process of trace collection, averaging, and image improvement. The feedback loop suggests an iterative refinement of the image analysis. The use of a BNN accelerator indicates a focus on efficient processing. The inclusion of denoising and filtering steps emphasizes the importance of noise reduction in the analysis.
### Interpretation
This diagram represents a system for analyzing images using a combination of BNN acceleration, TDC trace collection, and image processing techniques. The iterative nature of the process suggests a desire to achieve high accuracy and robustness in the analysis. The feedback loop allows for continuous improvement of the image quality and trace data. The system appears designed to extract meaningful information from noisy or imperfect images by leveraging both hardware acceleration and software-based signal processing. The diagram does not provide specific data or numerical values, but rather outlines the logical flow of the analysis process. It suggests a system that prioritizes iterative refinement and noise reduction to achieve reliable results.