## Data Flow Diagram: Knowledge Graph Based Prediction
### Overview
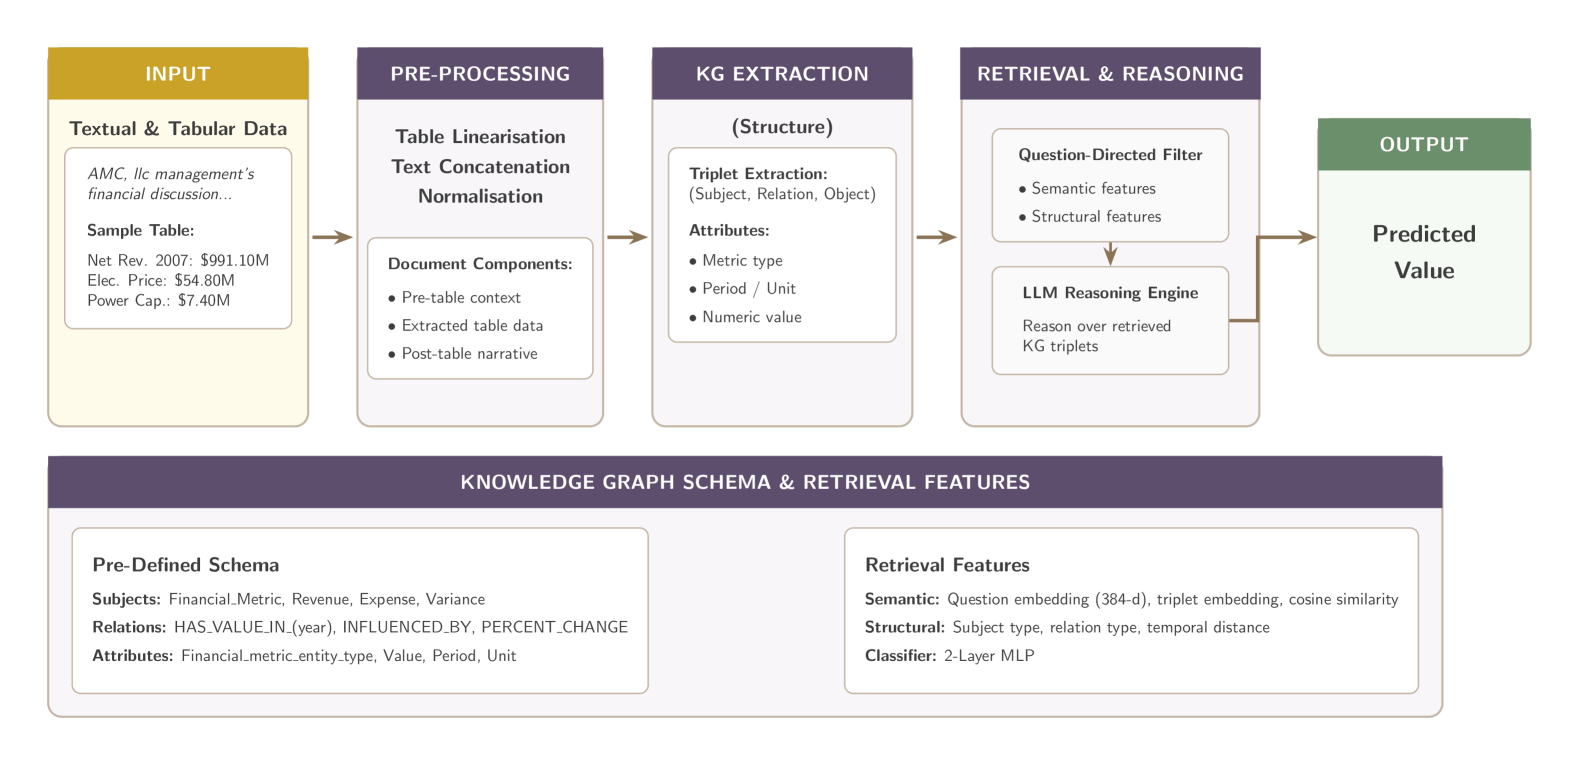
The image is a data flow diagram illustrating a process for predicting values using textual and tabular data, knowledge graph extraction, and reasoning. The diagram outlines the steps from input data to a predicted output value, highlighting the key components and processes involved.
### Components/Axes
The diagram consists of the following components, arranged from left to right:
1. **INPUT**: A yellow box on the top-left.
2. **PRE-PROCESSING**: A beige box to the right of the INPUT box.
3. **KG EXTRACTION**: A beige box to the right of the PRE-PROCESSING box.
4. **RETRIEVAL & REASONING**: A beige box to the right of the KG EXTRACTION box.
5. **OUTPUT**: A green box on the top-right.
6. **KNOWLEDGE GRAPH SCHEMA & RETRIEVAL FEATURES**: A purple box at the bottom, spanning the width of the diagram.
Each box contains text describing the processes or data involved. Arrows indicate the flow of data between the boxes.
### Detailed Analysis or ### Content Details
**1. INPUT (Top-Left, Yellow Box)**
* **Title**: INPUT
* **Content**:
* Textual & Tabular Data
* AMC, IIc management's financial discussion...
* Sample Table:
* Net Rev. 2007: \$991.10M
* Elec. Price: \$54.80M
* Power Cap.: \$7.40M
**2. PRE-PROCESSING (Top-Middle-Left, Beige Box)**
* **Title**: PRE-PROCESSING
* **Content**:
* Table Linearisation
* Text Concatenation
* Normalisation
* Document Components:
* Pre-table context
* Extracted table data
* Post-table narrative
**3. KG EXTRACTION (Top-Middle, Beige Box)**
* **Title**: KG EXTRACTION
* **Content**:
* (Structure)
* Triplet Extraction: (Subject, Relation, Object)
* Attributes:
* Metric type
* Period / Unit
* Numeric value
**4. RETRIEVAL & REASONING (Top-Middle-Right, Beige Box)**
* **Title**: RETRIEVAL & REASONING
* **Content**:
* Question-Directed Filter
* Semantic features
* Structural features
* LLM Reasoning Engine
* Reason over retrieved KG triplets
**5. OUTPUT (Top-Right, Green Box)**
* **Title**: OUTPUT
* **Content**:
* Predicted Value
**6. KNOWLEDGE GRAPH SCHEMA & RETRIEVAL FEATURES (Bottom, Purple Box)**
* **Title**: KNOWLEDGE GRAPH SCHEMA & RETRIEVAL FEATURES
* **Content**:
* **Pre-Defined Schema**:
* Subjects: Financial\_Metric, Revenue, Expense, Variance
* Relations: HAS\_VALUE\_IN\_(year), INFLUENCED\_BY, PERCENT\_CHANGE
* Attributes: Financial\_metric\_entity\_type, Value, Period, Unit
* **Retrieval Features**:
* Semantic: Question embedding (384-d), triplet embedding, cosine similarity
* Structural: Subject type, relation type, temporal distance
* Classifier: 2-Layer MLP
### Key Observations
* The diagram illustrates a pipeline for predicting values from textual and tabular data.
* The process involves pre-processing the input data, extracting knowledge graph triplets, reasoning over the extracted knowledge, and finally predicting a value.
* The knowledge graph schema defines the structure of the knowledge used for reasoning.
* Retrieval features are used to filter and rank the relevant knowledge graph triplets.
### Interpretation
The diagram describes a system that leverages knowledge graphs to predict values from textual and tabular data. The system first extracts structured information (triplets) from the input data and then uses this information, along with a pre-defined schema, to reason and generate a prediction. The use of an LLM (Large Language Model) reasoning engine suggests that the system is capable of complex reasoning and inference. The inclusion of semantic and structural retrieval features indicates that the system is designed to efficiently retrieve relevant information from the knowledge graph. This approach is useful for tasks where contextual understanding and reasoning are important for accurate prediction.