\n
## Diagram: Knowledge Graph Pipeline for Financial Prediction
### Overview
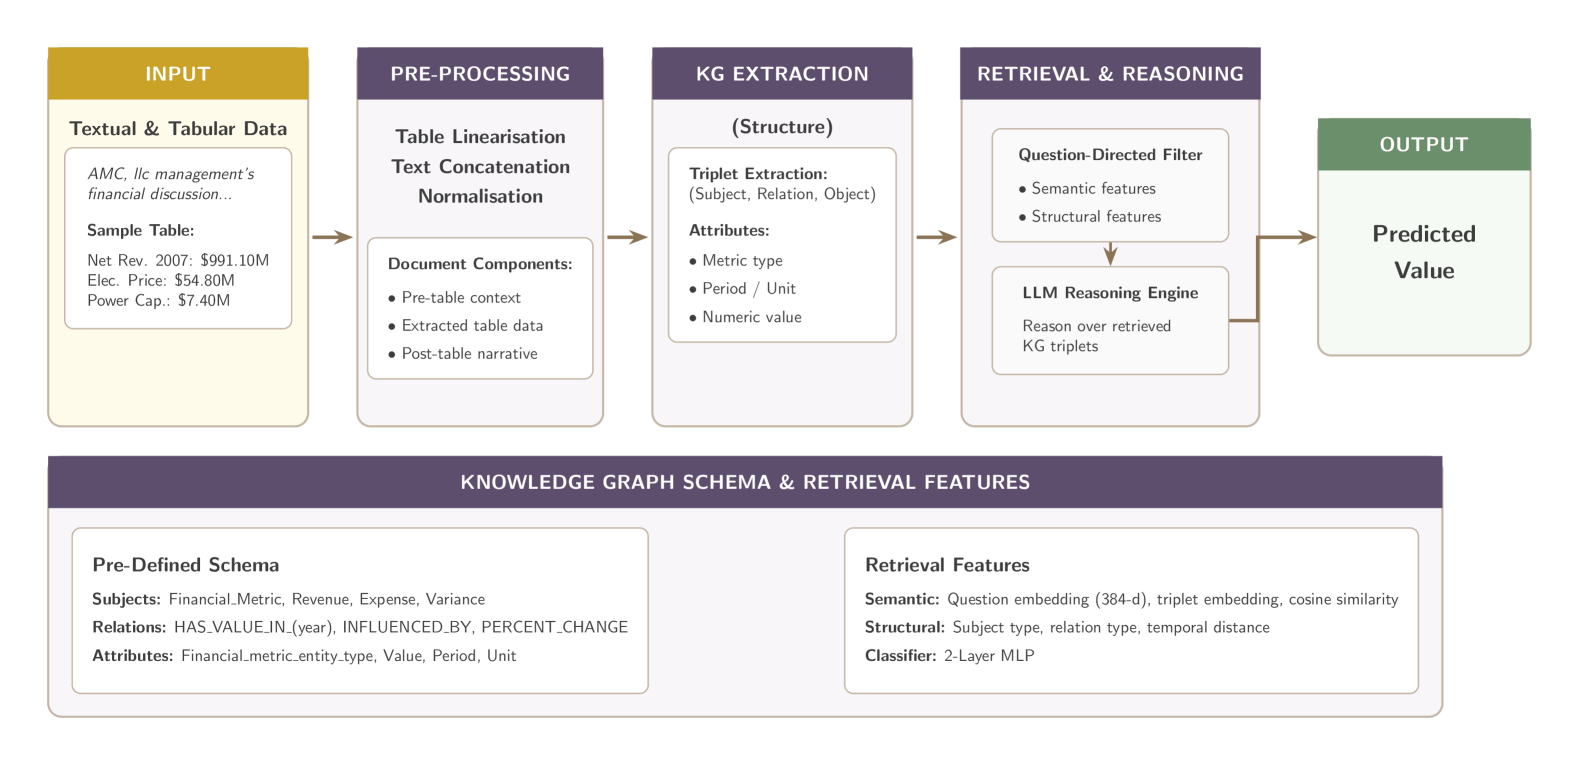
This diagram illustrates a pipeline for predicting financial values using a knowledge graph (KG) approach. The pipeline consists of five main stages: Input, Pre-processing, KG Extraction, Retrieval & Reasoning, and Output. Below the main pipeline is a section detailing the Knowledge Graph Schema & Retrieval Features. The diagram uses a flow chart style with rounded rectangles representing stages and arrows indicating the flow of data.
### Components/Axes
The diagram is segmented into two main sections: the pipeline itself (top) and the knowledge graph details (bottom).
**Pipeline Stages:**
* **INPUT:** Textual & Tabular Data
* **PRE-PROCESSING:** Table Linearisation, Text Concatenation, Normalisation
* **KG EXTRACTION (Structure):** Triplet Extraction (Subject, Relation, Object)
* **RETRIEVAL & REASONING:** Question-Directed Filter
* **OUTPUT:** Predicted Value
**KG Extraction Attributes:**
* Metric type
* Period / Unit
* Numeric value
**Retrieval & Reasoning Components:**
* Semantic features
* Structural features
* LLM Reasoning Engine
**Knowledge Graph Schema:**
* **Subjects:** Financial.Metric, Revenue, Expense, Variance
* **Relations:** HAS_VALUE_IN (year), INFLUENCED_BY, PERCENT_CHANGE
* **Attributes:** Financial.metric.entity.type, Value, Period, Unit
**Retrieval Features:**
* **Semantic:** Question embedding (384-d), triplet embedding, cosine similarity
* **Structural:** Subject type, relation type, temporal distance
* **Classifier:** 2-Layer MLP
### Detailed Analysis or Content Details
**Input Stage:**
* Example Text: "AMC, Ilc management's financial discussion..."
* Sample Table:
* Net Rev. 2007: $991.10M
* Elec. Price: $54.80M
* Power Cap.: $7.40M
**Pre-processing Stage:**
* Document Components:
* Pre-table context
* Extracted table data
* Post-table narrative
**KG Extraction Stage:**
* Triplet Extraction: The stage extracts triplets in the form (Subject, Relation, Object).
* Attributes: Metric type, Period/Unit, Numeric value.
**Retrieval & Reasoning Stage:**
* Question-Directed Filter: Uses Semantic and Structural features.
* LLM Reasoning Engine: Reasons over retrieved KG triplets.
**Output Stage:**
* Predicted Value
**Knowledge Graph Schema:**
* Subjects: Financial.Metric, Revenue, Expense, Variance.
* Relations: HAS_VALUE_IN (year), INFLUENCED_BY, PERCENT_CHANGE.
* Attributes: Financial.metric.entity.type, Value, Period, Unit.
**Retrieval Features:**
* Semantic: Question embedding (384-dimensional), triplet embedding, cosine similarity.
* Structural: Subject type, relation type, temporal distance.
* Classifier: 2-Layer Multi-Layer Perceptron (MLP).
### Key Observations
The pipeline emphasizes the conversion of raw financial data into a structured knowledge graph. The use of an LLM Reasoning Engine suggests a sophisticated approach to inference and prediction. The schema is specifically tailored to financial metrics, with relations focusing on temporal aspects and influences. The retrieval features combine semantic understanding (embeddings) with structural information (types, distances).
### Interpretation
This diagram outlines a system for automated financial analysis and prediction. The core idea is to represent financial information as a knowledge graph, allowing for complex reasoning and inference. The pipeline transforms unstructured data (text and tables) into a structured format suitable for machine learning. The LLM Reasoning Engine is the key component that leverages the knowledge graph to generate predictions. The inclusion of both semantic and structural retrieval features suggests a hybrid approach that combines the strengths of both methods. The schema is designed to capture the relationships between financial metrics over time and their influencing factors. The use of a 2-layer MLP as a classifier indicates a relatively simple machine learning model is used for the final prediction step, potentially after the LLM has performed more complex reasoning. The diagram suggests a focus on extracting and utilizing contextual information surrounding the numerical data, rather than solely relying on the numbers themselves.