## Flowchart: Financial Data Processing System
### Overview
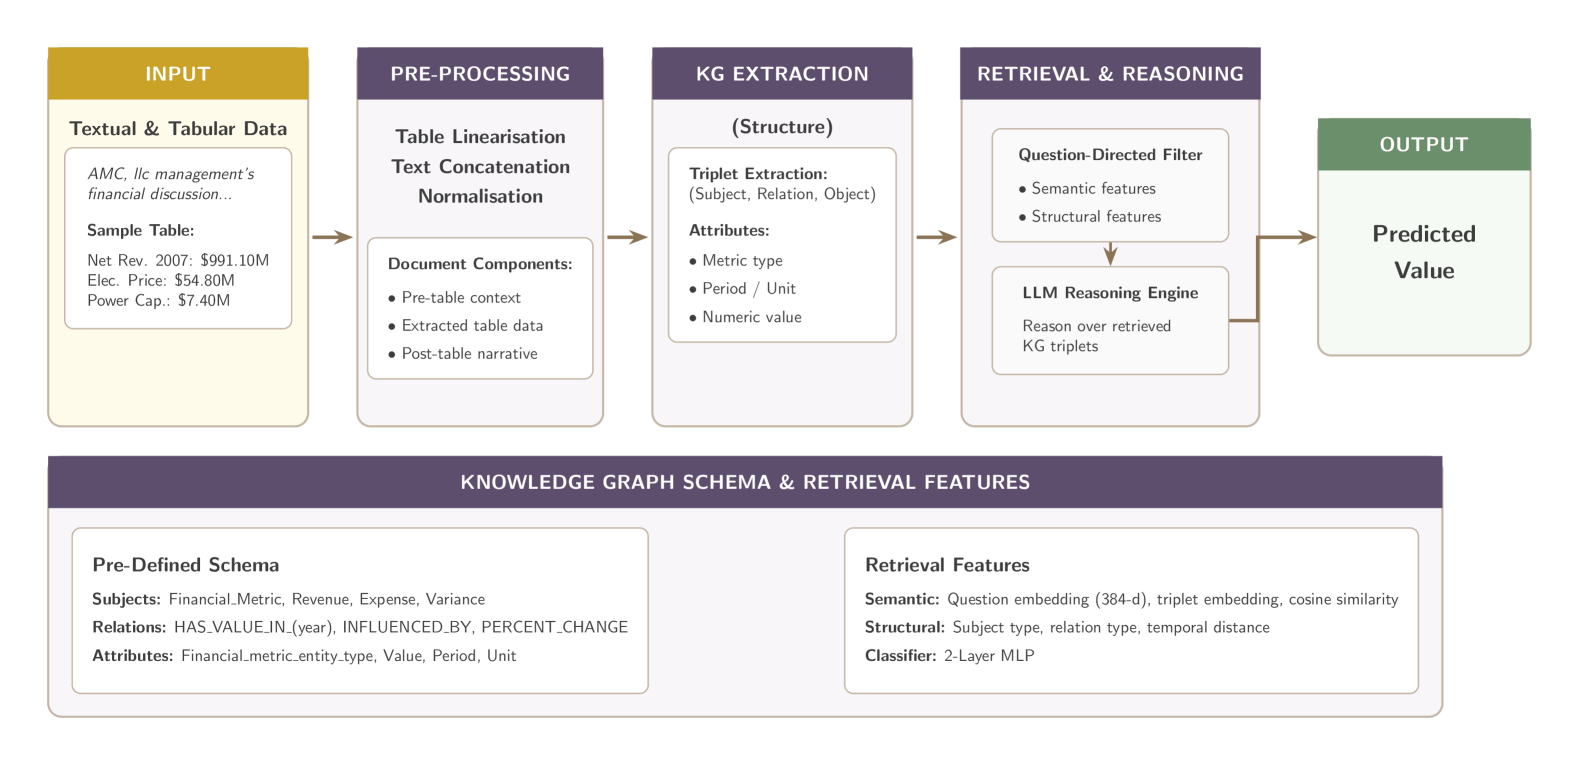
The diagram illustrates a multi-stage pipeline for processing financial data, transforming raw textual and tabular inputs into a predicted value through knowledge graph extraction, retrieval, and reasoning. The workflow progresses linearly from left to right, with distinct color-coded stages.
### Components/Axes
1. **Stages** (Color-coded blocks):
- **INPUT** (Orange): Textual & Tabular Data
- **PRE-PROCESSING** (Purple): Table Linearisation, Text Concatenation, Normalisation
- **KG EXTRACTION** (Purple): Triplet Extraction (Subject, Relation, Object), Attributes
- **RETRIEVAL & REASONING** (Purple): Question-Directed Filter, LLM Reasoning Engine
- **OUTPUT** (Green): Predicted Value
2. **Arrows**: Brown directional arrows connect stages sequentially.
3. **Textual Elements**:
- **INPUT**:
- "AMC, Inc management's financial discussion..."
- Sample Table:
- Net Rev. 2007: $991.10M
- Elec. Price: $54.80M
- Power Cap: $7.40M
- **PRE-PROCESSING**:
- Document Components: Pre-table context, Extracted table data, Post-table narrative
- **KG EXTRACTION**:
- Triplet Extraction: (Subject, Relation, Object)
- Attributes: Metric type, Period/Unit, Numeric value
- **RETRIEVAL & REASONING**:
- Question-Directed Filter: Semantic features, Structural features
- LLM Reasoning Engine: Reasons over retrieved KG triplets
- **OUTPUT**: Predicted Value
4. **Lower Section** (Purple block):
- **Pre-Defined Schema**:
- Subjects: Financial_Metric, Revenue, Expense, Variance
- Relations: HAS_VALUE_IN_(year), INFLUENCED_BY, PERCENT_CHANGE
- Attributes: Financial_metric_entity_type, Value, Period, Unit
- **Retrieval Features**:
- Semantic: Question embedding (384-d), triplet embedding, cosine similarity
- Structural: Subject type, relation type, temporal distance
- Classifier: 2-Layer MLP
### Detailed Analysis
- **INPUT Stage**: Contains both textual narrative ("AMC, Inc management's financial discussion...") and structured tabular data with financial metrics (Net Revenue, Electricity Price, Power Capacity) for 2007.
- **PRE-PROCESSING**: Focuses on normalizing data through table linearization, text concatenation, and normalization, preserving contextual relationships.
- **KG EXTRACTION**: Converts processed data into structured triplets (e.g., "Revenue HAS_VALUE_IN_(2007) $991.10M") and attributes like metric type and units.
- **RETRIEVAL & REASONING**: Uses semantic/structural filters to match queries against the knowledge graph, followed by LLM-based reasoning over triplets to derive insights.
- **OUTPUT**: Final predicted value, likely a financial metric (e.g., future revenue or variance).
### Key Observations
1. **Color Coding**: Stages are visually distinct (orange → purple → green), aiding workflow comprehension.
2. **Triplet Structure**: Knowledge graph relationships are explicitly defined (e.g., "INFLUENCED_BY" between metrics).
3. **Hybrid Data Handling**: Combines textual analysis (narratives) with structured data (tables) for robust processing.
4. **LLM Integration**: Leverages large language models for contextual reasoning over extracted knowledge graph data.
### Interpretation
This system demonstrates a knowledge-driven approach to financial analysis, where:
- **Pre-processing** ensures data consistency before knowledge graph construction.
- **KG Extraction** captures semantic relationships (e.g., "Revenue INFLUENCED_BY Expense").
- **Retrieval & Reasoning** enables dynamic query answering using both semantic similarity (cosine) and structural features (temporal distance).
- The **2-Layer MLP classifier** suggests a machine learning component for pattern recognition in retrieved triplets.
The pipeline emphasizes end-to-end traceability from raw data to predictions, with explicit schema definitions ensuring alignment between input data and knowledge graph structure. The use of 384-d embeddings indicates state-of-the-art NLP techniques for semantic matching.