\n
## Diagram: List of Knowledge Management Challenges
### Overview
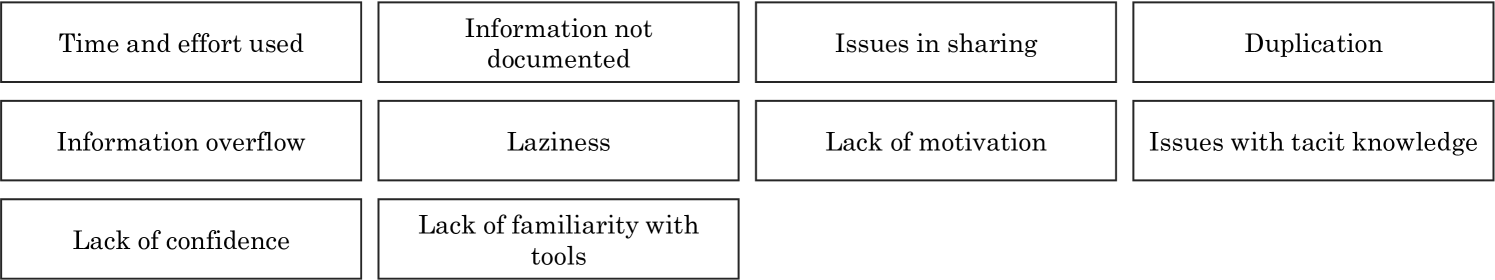
The image displays a conceptual diagram consisting of ten rectangular boxes arranged in a grid-like pattern. Each box contains a short phrase describing a potential barrier, challenge, or negative factor related to knowledge management, information sharing, or personal productivity. The diagram presents these items as discrete, categorized concepts without explicit visual connections or flow lines.
### Components/Axes
The diagram is structured as a simple grid with three rows and four columns, though the third row is incomplete.
* **Layout:** 3 rows x 4 columns grid (last row has only 2 items).
* **Visual Elements:** Ten identical, horizontally oriented rectangular boxes with black borders and white backgrounds. Text is centered within each box in a standard serif font.
* **Content:** Each box contains a unique textual label.
### Detailed Analysis
The textual content of each box, listed in reading order (left-to-right, top-to-bottom), is as follows:
**Row 1:**
1. **Top-left:** "Time and effort used"
2. **Top-center-left:** "Information not documented"
3. **Top-center-right:** "Issues in sharing"
4. **Top-right:** "Duplication"
**Row 2:**
5. **Middle-left:** "Information overflow"
6. **Middle-center-left:** "Laziness"
7. **Middle-center-right:** "Lack of motivation"
8. **Middle-right:** "Issues with tacit knowledge"
**Row 3:**
9. **Bottom-left:** "Lack of confidence"
10. **Bottom-center-left:** "Lack of familiarity with tools"
### Key Observations
* **Categorical Grouping:** The items can be loosely grouped into themes:
* **Process/Resource Barriers:** "Time and effort used", "Information not documented", "Duplication".
* **Information Quality/Volume Issues:** "Information overflow", "Issues with tacit knowledge".
* **Human/Behavioral Factors:** "Laziness", "Lack of motivation", "Lack of confidence", "Lack of familiarity with tools".
* **Communication Barriers:** "Issues in sharing".
* **Lack of Hierarchy or Flow:** The diagram presents all items as equally weighted, standalone concepts. There is no indicated sequence, causality, or priority.
* **No Quantitative Data:** The diagram is purely qualitative. It lists concepts but provides no metrics, frequencies, or comparative data.
### Interpretation
This diagram serves as a **brainstorming or diagnostic tool** for identifying obstacles in knowledge management systems or collaborative work environments. The listed items represent common pain points that can hinder the effective capture, sharing, and utilization of information within a team or organization.
The inclusion of both systemic issues (e.g., "Information overflow," "Duplication") and personal/psychological factors (e.g., "Laziness," "Lack of confidence") suggests a holistic view of the problem. It implies that solutions must address not only tools and processes but also human motivation, skills, and organizational culture.
The absence of connections between the boxes is notable. In a more detailed model, one might draw relationships—for example, "Lack of familiarity with tools" could contribute to "Information not documented," which in turn leads to "Duplication." The current presentation, however, simply catalogs the challenges, making it a useful starting point for discussion or further analysis.