## Text Grid: Common Challenges in Knowledge Management
### Overview
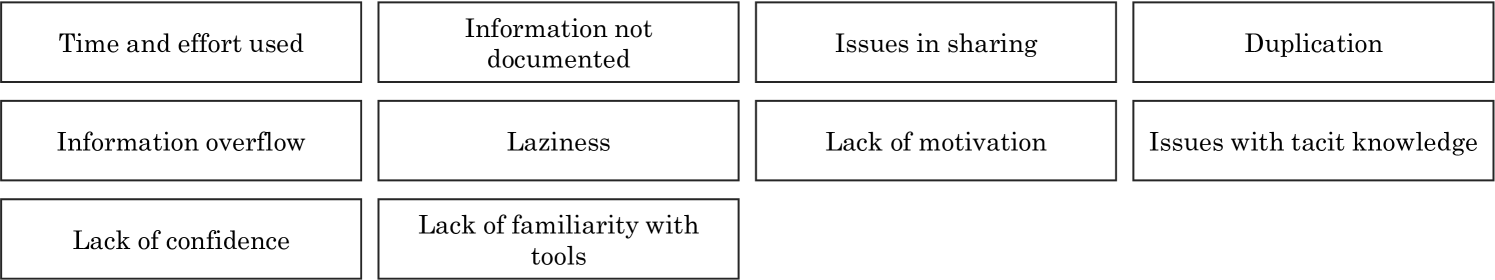
The image displays a 4x3 grid of text boxes containing labels describing potential challenges in organizational or team workflows. The grid is structured with 12 cells, 9 of which contain text, while 3 remain empty. Labels are centered within each box, using a consistent sans-serif font.
### Components/Axes
- **Grid Structure**: 4 columns × 3 rows (total 12 cells)
- **Text Orientation**: All labels are horizontally centered within their respective cells
- **Typography**: Uniform black text on white background
- **Spacing**: Equal padding between cells and rows
### Detailed Analysis
**Row 1 (Top Row)**:
1. "Time and effort used"
2. "Information not documented"
3. "Issues in sharing"
4. "Duplication"
**Row 2 (Middle Row)**:
5. "Information overflow"
6. "Laziness"
7. "Lack of motivation"
8. "Issues with tacit knowledge"
**Row 3 (Bottom Row)**:
9. "Lack of confidence"
10. "Lack of familiarity with tools"
11. (Empty cell)
12. (Empty cell)
### Key Observations
1. **Thematic Grouping**: Labels cluster around three core themes:
- Resource management ("Time and effort used")
- Knowledge handling ("Information not documented", "Duplication")
- Human factors ("Laziness", "Lack of motivation")
2. **Progression**: The grid shows a logical flow from operational challenges (top row) to human-centric issues (bottom row).
3. **Missing Data**: Two empty cells in the bottom-right corner suggest incomplete categorization or potential for additional challenges.
### Interpretation
This grid represents a taxonomy of common barriers to effective knowledge management. The progression from operational to human factors suggests a framework for diagnosing organizational inefficiencies. Notably:
- **Interconnected Challenges**: "Issues in sharing" and "Duplication" directly relate to poor information handling systems
- **Human Element**: The bottom row emphasizes psychological/behavioral barriers that may require different mitigation strategies than technical solutions
- **Gaps in Coverage**: The empty cells might indicate underrepresented challenges like "Resistance to change" or "Inadequate training"
The structured presentation implies this could serve as a diagnostic tool for teams to self-assess workflow issues, with potential applications in process improvement methodologies like Lean or Six Sigma.