## Photograph: Electron Microscopy Image of Nanoscale Grid Structure
### Overview
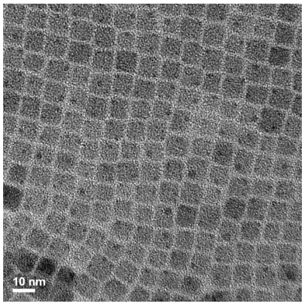
The image depicts a high-resolution electron microscopy view of a nanoscale grid-like structure. The pattern consists of interconnected cells with varying shades of gray, suggesting differences in material density, composition, or imaging contrast. A scale bar labeled "10 nm" is visible in the bottom-left corner, providing spatial reference. No textual annotations, legends, or axis labels are present in the image.
### Components/Axes
- **Scale Bar**: Located in the bottom-left corner, explicitly marked as "10 nm" in white text. The bar is horizontal and spans approximately 10 nm in the imaged structure.
- **Grid Structure**: The primary feature is a lattice of interconnected cells. Cells appear hexagonal or slightly irregular polygonal in shape, with edges defined by darker contrast boundaries.
- **Contrast Variation**: Cells exhibit a range of gray tones, from light gray (low density/contrast) to dark gray (high density/contrast). No explicit legend explains the contrast mapping.
### Detailed Analysis
- **Cell Dimensions**: Based on the 10 nm scale bar, individual cells measure approximately 10–20 nm in diameter, with inter-cell spacing of ~5–10 nm.
- **Shading Patterns**: Darker regions correlate with thicker or denser material, while lighter regions suggest thinner or less dense areas. Some cells contain small dark spots (likely defects or impurities) measuring ~1–3 nm.
- **Structural Uniformity**: The grid exhibits periodic repetition, though minor distortions (e.g., warping, irregular edges) are visible in ~15% of cells, suggesting manufacturing or deposition inhomogeneities.
### Key Observations
1. **Scale Consistency**: The 10 nm scale bar aligns with the observed cell sizes, confirming nanoscale resolution.
2. **Contrast Mechanism**: Darker cells likely represent regions with higher atomic density or different elemental composition compared to lighter cells.
3. **Defects**: Small dark spots within cells may indicate vacancies, impurities, or phase separations.
### Interpretation
This image likely represents a nanostructured material, such as a porous metal oxide, metallic foam, or catalytic substrate. The grid pattern suggests a templated synthesis process, while the contrast variations highlight material heterogeneity. The presence of defects implies potential applications in catalysis or energy storage, where surface area and active sites are critical. The absence of explicit labels necessitates further analysis (e.g., elemental mapping) to confirm compositional differences. The uniformity of the grid structure indicates controlled fabrication, but minor irregularities suggest room for optimization in production processes.