## Line Chart: EGA vs. Environment Step for Different c0 Values
### Overview
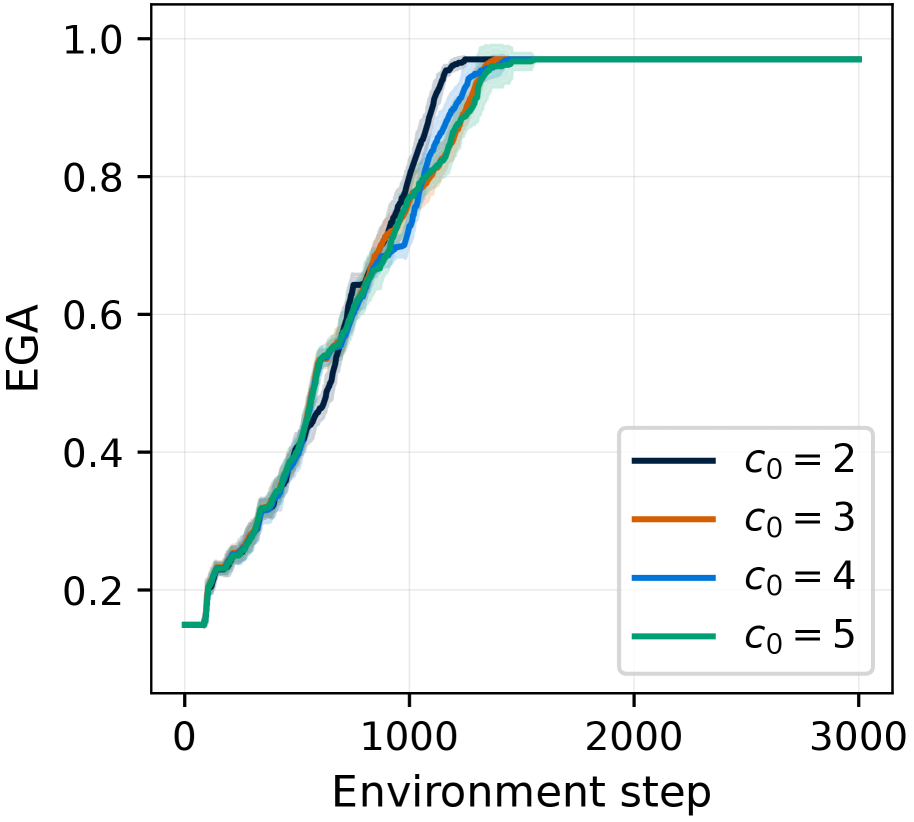
The image is a line chart that plots EGA (likely an abbreviation for an evaluation metric) against the environment step for four different values of a parameter denoted as "c0". The chart compares the performance of a system or algorithm under varying conditions, showing how EGA changes as the environment step increases. The chart includes a legend in the bottom-right corner that identifies each line by its corresponding c0 value.
### Components/Axes
* **X-axis:** "Environment step", ranging from 0 to 3000, with tick marks at intervals of 1000.
* **Y-axis:** "EGA", ranging from 0.2 to 1.0, with tick marks at intervals of 0.2.
* **Legend:** Located in the bottom-right corner, it identifies the lines by their c0 values:
* c0 = 2 (Dark Blue)
* c0 = 3 (Orange)
* c0 = 4 (Blue)
* c0 = 5 (Teal)
### Detailed Analysis
* **c0 = 2 (Dark Blue):** The line starts at an EGA of approximately 0.2 around environment step 0. It then increases steadily, reaching an EGA of approximately 0.95 around environment step 1500. After that, it plateaus at around 0.97.
* **c0 = 3 (Orange):** The line starts at an EGA of approximately 0.2 around environment step 0. It then increases steadily, reaching an EGA of approximately 0.9 around environment step 1200. After that, it plateaus at around 0.97.
* **c0 = 4 (Blue):** The line starts at an EGA of approximately 0.2 around environment step 0. It then increases steadily, reaching an EGA of approximately 0.95 around environment step 1400. After that, it plateaus at around 0.97.
* **c0 = 5 (Teal):** The line starts at an EGA of approximately 0.15 around environment step 0. It then increases steadily, reaching an EGA of approximately 0.97 around environment step 1500. After that, it plateaus at around 0.97.
### Key Observations
* All four lines show a similar trend: a rapid increase in EGA in the early environment steps, followed by a plateau at a high EGA value.
* The c0 = 5 line (Teal) starts at a slightly lower EGA value than the other lines.
* The c0 = 3 line (Orange) seems to increase slightly faster than the other lines initially.
* All lines converge to a similar EGA value (approximately 0.97) after around 1500 environment steps.
### Interpretation
The chart suggests that the parameter "c0" influences the initial learning rate or performance of the system, but its impact diminishes as the environment step increases. Specifically, a higher c0 value (c0 = 5) seems to result in a slightly lower initial EGA, while a c0 value of 3 results in a slightly faster initial increase in EGA. However, regardless of the c0 value, the system eventually achieves a similar high level of performance (EGA ≈ 0.97) after a sufficient number of environment steps. This indicates that the system is robust to variations in the c0 parameter in the long run.