\n
## Line Chart: EGA vs. Environment Step for Different c₀ Values
### Overview
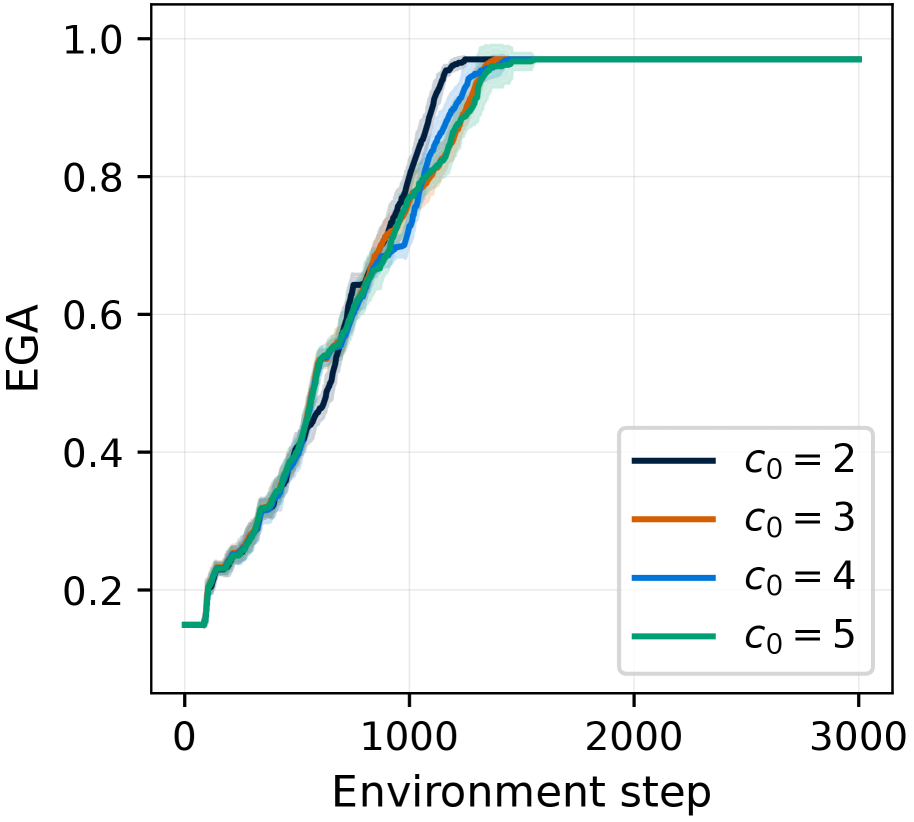
The image presents a line chart illustrating the relationship between EGA (likely an abbreviation for a performance metric) and Environment Step for four different values of c₀. The chart appears to demonstrate how EGA evolves over time (represented by Environment Step) for varying initial conditions (c₀).
### Components/Axes
* **X-axis:** "Environment step" ranging from approximately 0 to 3000. The scale is linear.
* **Y-axis:** "EGA" ranging from approximately 0.0 to 1.0. The scale is linear.
* **Legend:** Located in the bottom-right corner of the chart. It identifies four data series, each corresponding to a different value of c₀:
* c₀ = 2 (Dark Blue)
* c₀ = 3 (Gray)
* c₀ = 4 (Orange)
* c₀ = 5 (Green)
* **Grid:** A light gray grid is present in the background, aiding in the readability of the data points.
### Detailed Analysis
The chart displays four lines, each representing a different c₀ value.
* **c₀ = 2 (Dark Blue):** The line starts at approximately EGA = 0.15 at Environment Step = 0. It increases steadily until approximately Environment Step = 800, where it begins to level off. By Environment Step = 1500, EGA reaches approximately 0.95 and remains relatively constant until Environment Step = 3000.
* **c₀ = 3 (Gray):** The line begins at approximately EGA = 0.15 at Environment Step = 0. It exhibits a similar trend to c₀ = 2, increasing steadily and leveling off around Environment Step = 1000. EGA reaches approximately 0.95 by Environment Step = 1500 and remains stable.
* **c₀ = 4 (Orange):** The line starts at approximately EGA = 0.18 at Environment Step = 0. It shows a similar pattern, with a steady increase followed by a leveling off around Environment Step = 900. EGA reaches approximately 0.95 by Environment Step = 1400 and remains stable.
* **c₀ = 5 (Green):** The line begins at approximately EGA = 0.15 at Environment Step = 0. It follows the same general trend as the other lines, increasing steadily and leveling off around Environment Step = 800. EGA reaches approximately 0.95 by Environment Step = 1300 and remains stable.
All four lines converge towards an EGA value of approximately 0.95-1.0 as the Environment Step increases.
### Key Observations
* All four lines exhibit a similar S-shaped curve, indicating a common underlying process.
* The lines converge as the Environment Step increases, suggesting that the initial value of c₀ has a diminishing effect on EGA as the system evolves.
* There is a slight variation in the rate of increase, with c₀ = 4 appearing to reach the plateau slightly earlier than the other values.
* The initial EGA values are relatively consistent across all c₀ values, around 0.15-0.18.
### Interpretation
The data suggests that EGA is a performance metric that improves with increasing Environment Step, and that the initial condition c₀ influences the *rate* of improvement, but not the final EGA value. The convergence of the lines indicates that the system reaches a stable state regardless of the initial c₀ value, given sufficient Environment Steps. The slight differences in the rate of improvement could be due to the sensitivity of the system to different initial conditions. The plateauing of the lines suggests that there is a limit to the performance improvement achievable, even with continued increases in Environment Step. This could represent a saturation point or a constraint within the system. Further investigation would be needed to understand the specific meaning of EGA, Environment Step, and c₀ within the context of the system being modeled.