## Line Graph: EGA Convergence Across Environment Steps
### Overview
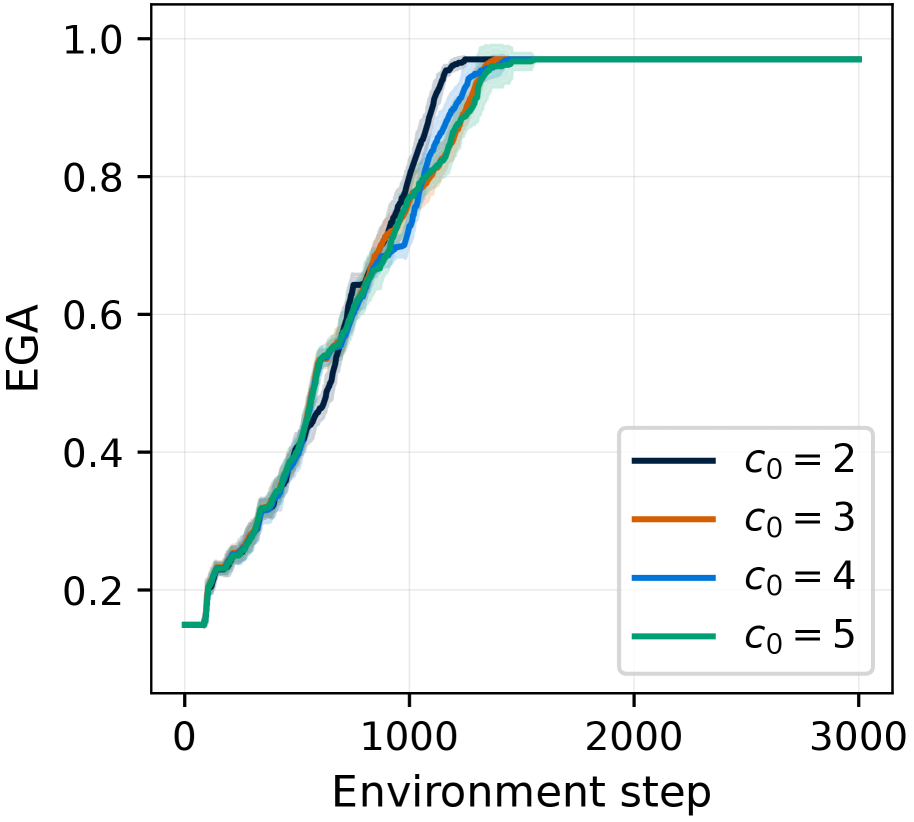
The image depicts a line graph illustrating the convergence of Expected Goal Achievement (EGA) across environment steps for four distinct configurations labeled `c₀ = 2`, `c₀ = 3`, `c₀ = 4`, and `c₀ = 5`. The graph shows how EGA values evolve over time (environment steps) and highlights differences in performance between configurations.
### Components/Axes
- **Y-Axis**: Labeled "EGA" with a scale from 0.0 to 1.0 in increments of 0.2.
- **X-Axis**: Labeled "Environment step" with a scale from 0 to 3000 in increments of 1000.
- **Legend**: Positioned in the bottom-right corner, mapping colors to `c₀` values:
- **Dark blue**: `c₀ = 2`
- **Orange**: `c₀ = 3`
- **Light blue**: `c₀ = 4`
- **Green**: `c₀ = 5`
- **Shaded Regions**: Light gray bands around each line, likely representing variability or confidence intervals.
### Detailed Analysis
1. **`c₀ = 5` (Green Line)**:
- Starts at ~0.2 EGA at 0 steps.
- Rises sharply to ~1.0 EGA by ~1000 steps.
- Plateaus at 1.0 for the remainder of the graph.
- Shaded region indicates minimal variability (~0.05 range).
2. **`c₀ = 4` (Light Blue Line)**:
- Begins at ~0.25 EGA at 0 steps.
- Peaks at ~0.95 EGA by ~1000 steps.
- Slightly declines to ~0.98 EGA by 3000 steps.
- Shaded region shows moderate variability (~0.07 range).
3. **`c₀ = 3` (Orange Line)**:
- Starts at ~0.25 EGA at 0 steps.
- Reaches ~0.9 EGA by ~1000 steps.
- Plateaus at ~0.92 EGA by 3000 steps.
- Shaded region indicates higher variability (~0.1 range).
4. **`c₀ = 2` (Dark Blue Line)**:
- Begins at ~0.15 EGA at 0 steps.
- Peaks at ~0.85 EGA by ~1000 steps.
- Stabilizes at ~0.88 EGA by 3000 steps.
- Shaded region shows the widest variability (~0.12 range).
### Key Observations
- All configurations converge toward 1.0 EGA by ~1000 steps, with `c₀ = 5` achieving this fastest.
- Higher `c₀` values correlate with faster and more stable convergence (e.g., `c₀ = 5` reaches 1.0 EGA earlier than others).
- Variability (shaded regions) decreases as `c₀` increases, suggesting more consistent performance in higher configurations.
- No outliers or anomalies are visible; all lines follow a similar upward trend with plateauing.
### Interpretation
The graph demonstrates that increasing `c₀` improves both the speed and stability of EGA convergence. Configurations with higher `c₀` values achieve near-optimal performance (1.0 EGA) more rapidly and maintain it longer, while lower `c₀` values exhibit slower convergence and greater variability. The shaded regions imply that experimental uncertainty decreases with higher `c₀`, possibly due to improved model robustness or parameter tuning. This suggests `c₀` is a critical hyperparameter for optimizing EGA in the tested environment.