## Chart: Step-wise Loss vs. Tokens
### Overview
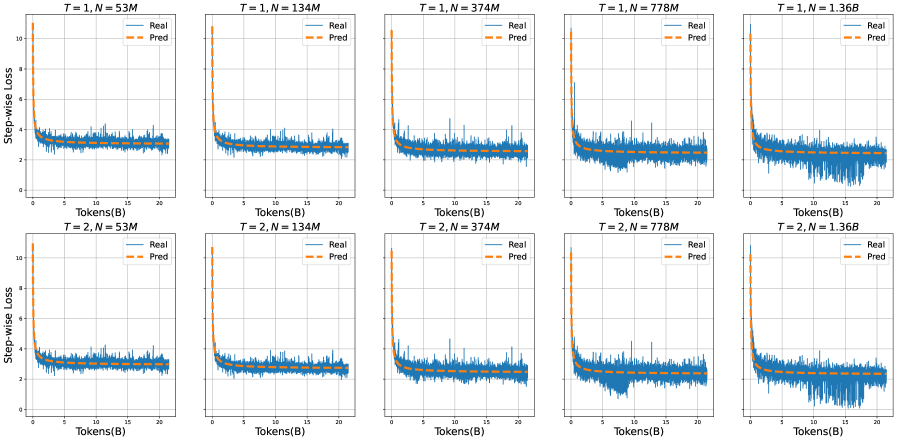
The image presents a series of line graphs showing the step-wise loss versus the number of tokens processed. There are 10 individual plots arranged in a 2x5 grid. Each plot displays two lines: "Real" (actual loss) and "Pred" (predicted loss). The plots are organized by two parameters, T and N, where T takes values 1 and 2, and N takes values 53M, 134M, 374M, 778M, and 1.36B.
### Components/Axes
* **X-axis:** Tokens (B), ranging from 0 to 20.
* **Y-axis:** Step-wise Loss, ranging from 0 to 10.
* **Legend:** Located in the top-right corner of each plot.
* "Real": Solid blue line, representing the actual step-wise loss.
* "Pred": Dashed orange line, representing the predicted step-wise loss.
* **Plot Titles:** Each plot has a title indicating the values of T and N.
* T = 1, N = 53M
* T = 1, N = 134M
* T = 1, N = 374M
* T = 1, N = 778M
* T = 1, N = 1.36B
* T = 2, N = 53M
* T = 2, N = 134M
* T = 2, N = 374M
* T = 2, N = 778M
* T = 2, N = 1.36B
### Detailed Analysis
Each plot shows a similar trend:
1. **Initial Drop:** Both "Real" and "Pred" lines start with a rapid decrease in step-wise loss as the number of tokens increases from 0 to approximately 5.
2. **Stabilization:** After the initial drop, the loss stabilizes and fluctuates around a lower value. The "Real" loss exhibits more variance than the "Pred" loss.
3. **"Real" Loss:** The "Real" loss line (blue) is noisy, showing high-frequency fluctuations.
4. **"Pred" Loss:** The "Pred" loss line (orange, dashed) is smoother, representing a more generalized trend.
**Specific Observations:**
* **T=1, N=53M:**
* "Real" loss starts around 4, drops to approximately 3 after 5 tokens, and fluctuates around 3.
* "Pred" loss starts around 10, drops to approximately 3 after 5 tokens, and remains stable around 3.
* **T=1, N=134M:**
* "Real" loss starts around 4, drops to approximately 2.5 after 5 tokens, and fluctuates around 2.5.
* "Pred" loss starts around 10, drops to approximately 2.5 after 5 tokens, and remains stable around 2.5.
* **T=1, N=374M:**
* "Real" loss starts around 4, drops to approximately 2.5 after 5 tokens, and fluctuates around 2.5.
* "Pred" loss starts around 10, drops to approximately 2.5 after 5 tokens, and remains stable around 2.5.
* **T=1, N=778M:**
* "Real" loss starts around 4, drops to approximately 2.5 after 5 tokens, and fluctuates around 2.5.
* "Pred" loss starts around 10, drops to approximately 2.5 after 5 tokens, and remains stable around 2.5.
* **T=1, N=1.36B:**
* "Real" loss starts around 4, drops to approximately 2 after 5 tokens, and fluctuates around 2.
* "Pred" loss starts around 10, drops to approximately 2 after 5 tokens, and remains stable around 2.
* **T=2, N=53M:**
* "Real" loss starts around 4, drops to approximately 3 after 5 tokens, and fluctuates around 3.
* "Pred" loss starts around 10, drops to approximately 3 after 5 tokens, and remains stable around 3.
* **T=2, N=134M:**
* "Real" loss starts around 4, drops to approximately 2.5 after 5 tokens, and fluctuates around 2.5.
* "Pred" loss starts around 10, drops to approximately 2.5 after 5 tokens, and remains stable around 2.5.
* **T=2, N=374M:**
* "Real" loss starts around 4, drops to approximately 2.5 after 5 tokens, and fluctuates around 2.5.
* "Pred" loss starts around 10, drops to approximately 2.5 after 5 tokens, and remains stable around 2.5.
* **T=2, N=778M:**
* "Real" loss starts around 4, drops to approximately 2.5 after 5 tokens, and fluctuates around 2.5.
* "Pred" loss starts around 10, drops to approximately 2.5 after 5 tokens, and remains stable around 2.5.
* **T=2, N=1.36B:**
* "Real" loss starts around 4, drops to approximately 2 after 5 tokens, and fluctuates around 2.
* "Pred" loss starts around 10, drops to approximately 2 after 5 tokens, and remains stable around 2.
### Key Observations
* The predicted loss consistently overestimates the initial loss but converges to a similar level as the real loss after a few tokens.
* The real loss exhibits significant fluctuations, indicating sensitivity to individual tokens.
* The predicted loss is smoother, suggesting it captures the overall trend but misses the fine-grained details.
* As N increases, the final stabilized loss value tends to decrease slightly.
### Interpretation
The plots illustrate the learning behavior of a model, showing how the step-wise loss decreases as the model processes more tokens. The difference between the "Real" and "Pred" lines indicates the model's ability to generalize from the training data. The initial overestimation by the "Pred" line suggests that the model initially struggles to accurately predict the loss, but it quickly adapts as it sees more data. The fluctuations in the "Real" loss highlight the inherent variability in the data, while the smoother "Pred" loss indicates the model's ability to filter out noise and capture the underlying trend. The slight decrease in stabilized loss as N increases suggests that larger models (higher N) may achieve slightly better performance. The parameter T seems to have little impact on the overall trend.