\n
## Line Chart: Step-wise Loss vs. Tokens for Different Configurations
### Overview
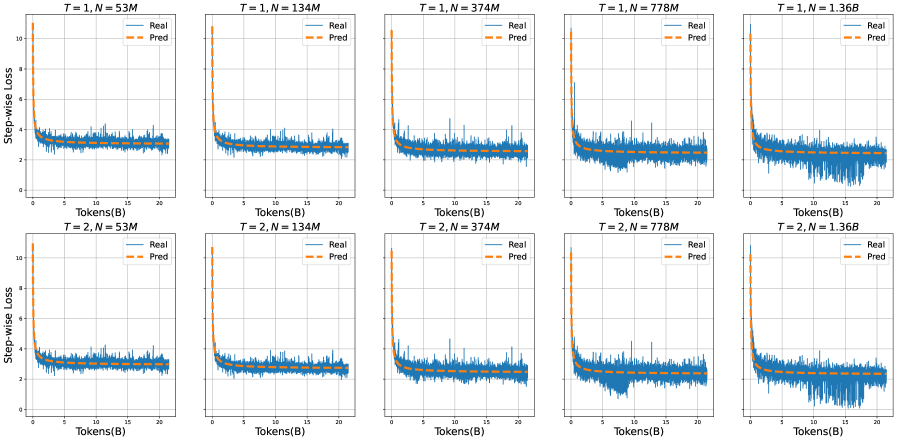
The image presents a 2x5 grid of line charts, each depicting the relationship between Step-wise Loss (y-axis) and Tokens (x-axis, in billions - B). Each chart represents a different configuration defined by two parameters: T (likely representing a time step or training iteration) and N (likely representing the model size or number of parameters, in millions - M). Two lines are plotted on each chart: "Real" (solid blue line) and "Pred" (dashed orange line). The charts aim to compare the actual loss ("Real") with a predicted loss ("Pred") as the model processes more tokens.
### Components/Axes
* **X-axis:** Tokens (B) - ranging from 0 to approximately 21 billion tokens.
* **Y-axis:** Step-wise Loss - ranging from 0 to approximately 11.
* **Legend:**
* Real (solid blue line)
* Pred (dashed orange line)
* **Titles:** Each chart has a title indicating the values of T and N. The titles are formatted as "T = [value], N = [value]M".
* **Grid:** A light gray grid is overlaid on each chart to aid in reading values.
### Detailed Analysis or Content Details
The charts are arranged in two rows (T=1 and T=2) and five columns (N=53M, 134M, 374M, 778M, 1.36B). I will analyze each chart individually, noting trends and approximate data points.
**Row 1 (T=1):**
* **T=1, N=53M:** Both "Real" and "Pred" lines fluctuate around a loss value of approximately 1-3. The "Pred" line is generally slightly above the "Real" line.
* **T=1, N=134M:** Similar to the previous chart, both lines fluctuate around 1-3, with "Pred" slightly above "Real". The fluctuations appear slightly more dampened.
* **T=1, N=374M:** The lines initially fluctuate around 1-3, but then exhibit a sharp drop in loss around 15 billion tokens, falling to approximately 0.2-0.5. "Pred" initially overestimates the loss, but converges towards "Real" after the drop.
* **T=1, N=778M:** Similar to the previous chart, a sharp drop in loss occurs around 15 billion tokens, falling to approximately 0.2-0.5. The "Pred" line shows a similar drop, but lags slightly behind the "Real" line.
* **T=1, N=1.36B:** A very pronounced drop in loss around 15 billion tokens, falling to approximately 0.1-0.3. The "Pred" line again lags behind the "Real" line, but follows the same general trend.
**Row 2 (T=2):**
* **T=2, N=53M:** Both lines fluctuate around 1-3, similar to T=1, N=53M. "Pred" is consistently above "Real".
* **T=2, N=134M:** Similar to T=2, N=53M, with fluctuations around 1-3 and "Pred" above "Real".
* **T=2, N=374M:** A sharp drop in loss around 15 billion tokens, falling to approximately 0.2-0.5. "Pred" initially overestimates, then converges.
* **T=2, N=778M:** A sharp drop in loss around 15 billion tokens, falling to approximately 0.2-0.5. "Pred" lags slightly.
* **T=2, N=1.36B:** A very pronounced drop in loss around 15 billion tokens, falling to approximately 0.1-0.3. "Pred" lags behind.
### Key Observations
* **Loss Drop:** A consistent and significant drop in Step-wise Loss is observed around 15 billion tokens for N values of 374M, 778M, and 1.36B in both T=1 and T=2 rows. This suggests a point of rapid learning or convergence for these model sizes.
* **Prediction Lag:** The "Pred" line consistently lags behind the "Real" line during the loss drop, indicating that the prediction model underestimates the rate of learning.
* **Model Size Impact:** The magnitude of the loss drop appears to increase with model size (N). The largest model (1.36B) exhibits the most dramatic drop.
* **T Value Impact:** The T value (1 or 2) doesn't seem to drastically alter the overall trend, but there are subtle differences in the fluctuations before the loss drop.
* **Small Model Behavior:** For smaller models (N=53M and 134M), the loss remains relatively stable, with no significant drop observed.
### Interpretation
The data suggests that the model's learning process undergoes a phase transition around 15 billion tokens, particularly for larger model sizes. This transition is characterized by a rapid decrease in Step-wise Loss, indicating improved performance. The prediction model consistently underestimates this learning rate, suggesting it may not fully capture the dynamics of the training process.
The increasing magnitude of the loss drop with model size implies that larger models are capable of more significant learning gains as they process more data. The smaller models, however, appear to reach a plateau in performance earlier, with no substantial improvement observed beyond a certain point.
The consistent lag in the "Pred" line suggests a potential area for improvement in the prediction model. Perhaps a more sophisticated model is needed to accurately forecast the learning trajectory of these larger language models. The fact that the prediction converges *to* the real loss, but with a delay, suggests the prediction model is fundamentally correct, but needs to be more responsive to changes in the training process.
The parameter 'T' likely represents the training epoch or a similar iteration metric. The similarity in trends between T=1 and T=2 suggests that the model is relatively stable across these iterations, and the primary driver of the observed behavior is the model size (N) and the amount of data processed (Tokens).