## Diagram: Functional Mapping Between Sets F and A
### Overview
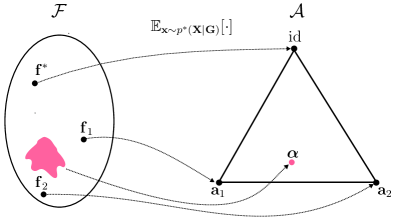
The diagram illustrates a conceptual relationship between two sets:
- **Set F** (left): Contains labeled points `f*`, `f1`, `f2`, and a pink blob.
- **Set A** (right): A triangle with vertices labeled `id`, `a1`, `a2`, and an internal point `α`.
Arrows connect elements of F to A, with a mathematical expectation term `E_{x~p*(X|G)}[·]` linking `f*` to `id`.
### Components/Axes
- **Set F**:
- **Points**:
- `f*` (black dot, top of circle).
- `f1` (black dot, upper-right).
- `f2` (black dot, lower-left).
- Pink blob (lower-left, overlapping `f2`).
- **Connections**:
- Arrows from `f*` → `id`, `f1` → `a1`, `f2` → `a2`.
- **Set A**:
- **Triangle Vertices**:
- `id` (top vertex).
- `a1` (bottom-left vertex).
- `a2` (bottom-right vertex).
- **Internal Point**:
- `α` (pink dot, near `a1`).
- **Connections**:
- Arrows from `id` → `a1` → `a2` (triangle edges).
- Arrow from `α` → `a1`.
### Content Details
- **Mathematical Notation**:
- `E_{x~p*(X|G)}[·]` (expectation of `x` sampled from distribution `p*(X|G)`).
- `id` (identity function or element).
- **Spatial Relationships**:
- `f*` is directly mapped to `id` via the expectation term.
- `f1` and `f2` map to `a1` and `a2`, respectively.
- `α` is positioned closer to `a1` than `a2`.
### Key Observations
1. **Structural Symmetry**:
- The triangle in A mirrors the connections from F, suggesting a one-to-one or one-to-many mapping.
2. **Expectation Term**:
- The term `E_{x~p*(X|G)}[·]` implies a probabilistic or statistical relationship between `f*` and `id`.
3. **Pink Blob**:
- The pink blob in F overlaps `f2`, possibly indicating a subset or special case of `f2`.
4. **Point `α`**:
- `α` is distinct from the triangle vertices but connected to `a1`, suggesting a secondary or derived role.
### Interpretation
This diagram likely represents a **functional or probabilistic mapping** between two abstract spaces:
- **Set F** could represent input features, states, or hypotheses (e.g., `f*` as a ground truth, `f1`/`f2` as alternatives).
- **Set A** might model outputs, actions, or decisions (e.g., `id` as a baseline, `a1`/`a2` as choices).
- The expectation term suggests that `f*` influences `id` through a distribution `p*(X|G)`, where `G` could be a conditioning variable (e.g., context or constraints).
- The pink blob and `α` highlight specific cases or anomalies within the mappings.
**Notable Patterns**:
- The direct link between `f*` and `id` via expectation implies `f*` is central to defining the relationship.
- The triangle’s internal point `α` may represent an equilibrium or optimized state derived from the mappings.
- The absence of numerical values suggests this is a conceptual or theoretical framework rather than empirical data.