## Diagram: Mathematical Mapping Between Sets ℱ and 𝒜
### Overview
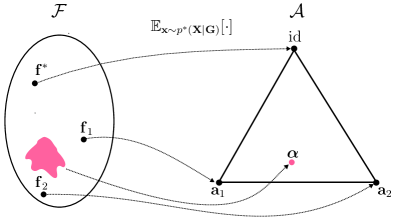
The image displays a theoretical or mathematical diagram illustrating mappings between two abstract sets. The left set, labeled with a script "ℱ" (likely representing a function space or feature space), contains several points and an unlabeled region. The right set, labeled with a script "𝒜" (likely representing an action space, parameter space, or algebra), is depicted as a triangle. Directed arrows (some solid, some dashed) indicate mappings or functions from elements in ℱ to elements in 𝒜. A mathematical expression is positioned above the diagram.
### Components/Axes
* **Left Set (ℱ):** An oval shape labeled with the script letter **ℱ** in the top-left corner.
* **Right Set (𝒜):** A triangle shape labeled with the script letter **𝒜** at the top vertex.
* **Mathematical Expression:** Centered above the diagram is the text: **E_{x∼p(x)}[·]**. This denotes an expectation over a variable `x` drawn from a distribution `p(x)`.
* **Points in ℱ:**
* **f\***: A point in the upper-left region of the oval.
* **f₁**: A point in the middle-right region of the oval.
* **f₂**: A point in the lower-left region of the oval.
* **Unlabeled Pink Region:** An irregular, solid pink shape located near point `f₂` in the lower-left quadrant of the oval. It is not associated with a text label.
* **Points in 𝒜:**
* **id**: A point at the top vertex of the triangle.
* **a₁**: A point at the bottom-left vertex of the triangle.
* **a₂**: A point at the bottom-right vertex of the triangle.
* **α**: A point inside the triangle, closer to the bottom edge and slightly right of center.
* **Mappings (Arrows):**
* A **dashed arrow** from **f\*** in ℱ to **id** in 𝒜.
* A **solid arrow** from **f₁** in ℱ to **a₁** in 𝒜.
* A **solid arrow** from **f₂** in ℱ to **a₂** in 𝒜.
* A **solid arrow** from **α** in 𝒜 to **a₂** in 𝒜 (an internal mapping within 𝒜).
* A **dashed arrow** from the **pink region** in ℱ to **a₁** in 𝒜.
### Detailed Analysis
The diagram defines specific correspondences:
1. The element `f*` maps to `id` (likely the identity element).
2. The element `f₁` maps to `a₁`.
3. The element `f₂` maps to `a₂`.
4. The unlabeled pink region within ℱ maps to `a₁`.
5. There is an internal mapping within 𝒜 from `α` to `a₂`.
The expression **E_{x∼p(x)}[·]** suggests the entire diagram or the mappings shown may be related to an expectation or average taken over a data distribution `p(x)`.
### Key Observations
* **Dual Representation:** The diagram contrasts a potentially continuous or complex space (ℱ, depicted as an oval) with a structured, discrete, or geometric space (𝒜, depicted as a triangle).
* **Mapping Types:** The use of both solid and dashed arrows may differentiate between types of mappings (e.g., deterministic vs. stochastic, primary vs. secondary, or defined vs. induced).
* **Unlabeled Element:** The pink region is a significant visual component but lacks a textual label, implying it represents a subset, a neighborhood, or a region of interest rather than a single point.
* **Internal Structure of 𝒜:** The triangle is not just a set of points; it has internal structure, as shown by the arrow from `α` to `a₂`. The vertices (`id`, `a₁`, `a₂`) may form a basis or a simplex.
### Interpretation
This diagram likely illustrates a concept from machine learning, optimization, or functional analysis. It visually represents a **mapping from a function/feature space (ℱ) to an action/parameter space (𝒜)**.
* **What it suggests:** The mapping could represent how different functions or models (`f*`, `f₁`, `f₂`) correspond to specific actions, parameters, or outcomes (`id`, `a₁`, `a₂`). The pink region mapping to `a₁` suggests that a whole family or neighborhood of functions in ℱ leads to the same outcome `a₁`.
* **Relationships:** The diagram establishes a structured relationship between the two spaces. The point `f*` mapping to `id` might represent an optimal or reference function. The internal arrow from `α` to `a₂` indicates that the space 𝒜 has its own dynamics or relationships independent of ℱ.
* **Role of the Expectation:** The overarching **E_{x∼p(x)}[·]** implies that these mappings or the properties being illustrated are considered in an average sense over a data distribution, which is a common theme in statistical learning theory and risk minimization.
* **Anomaly/Notable Feature:** The most notable feature is the **unlabeled pink region**. Its presence and specific mapping to `a₁` (shared with `f₁`) highlight that the relationship between the spaces is not necessarily one-to-one and that regions in ℱ can have significant meaning. This could represent a concept like a "basin of attraction" or a "region of equivalence" in the function space.
In essence, the diagram is a conceptual tool for visualizing how elements or regions in one mathematical space relate to elements in another, under the umbrella of an expected value calculation.