# Technical Document Extraction: Line Chart Analysis
## Title
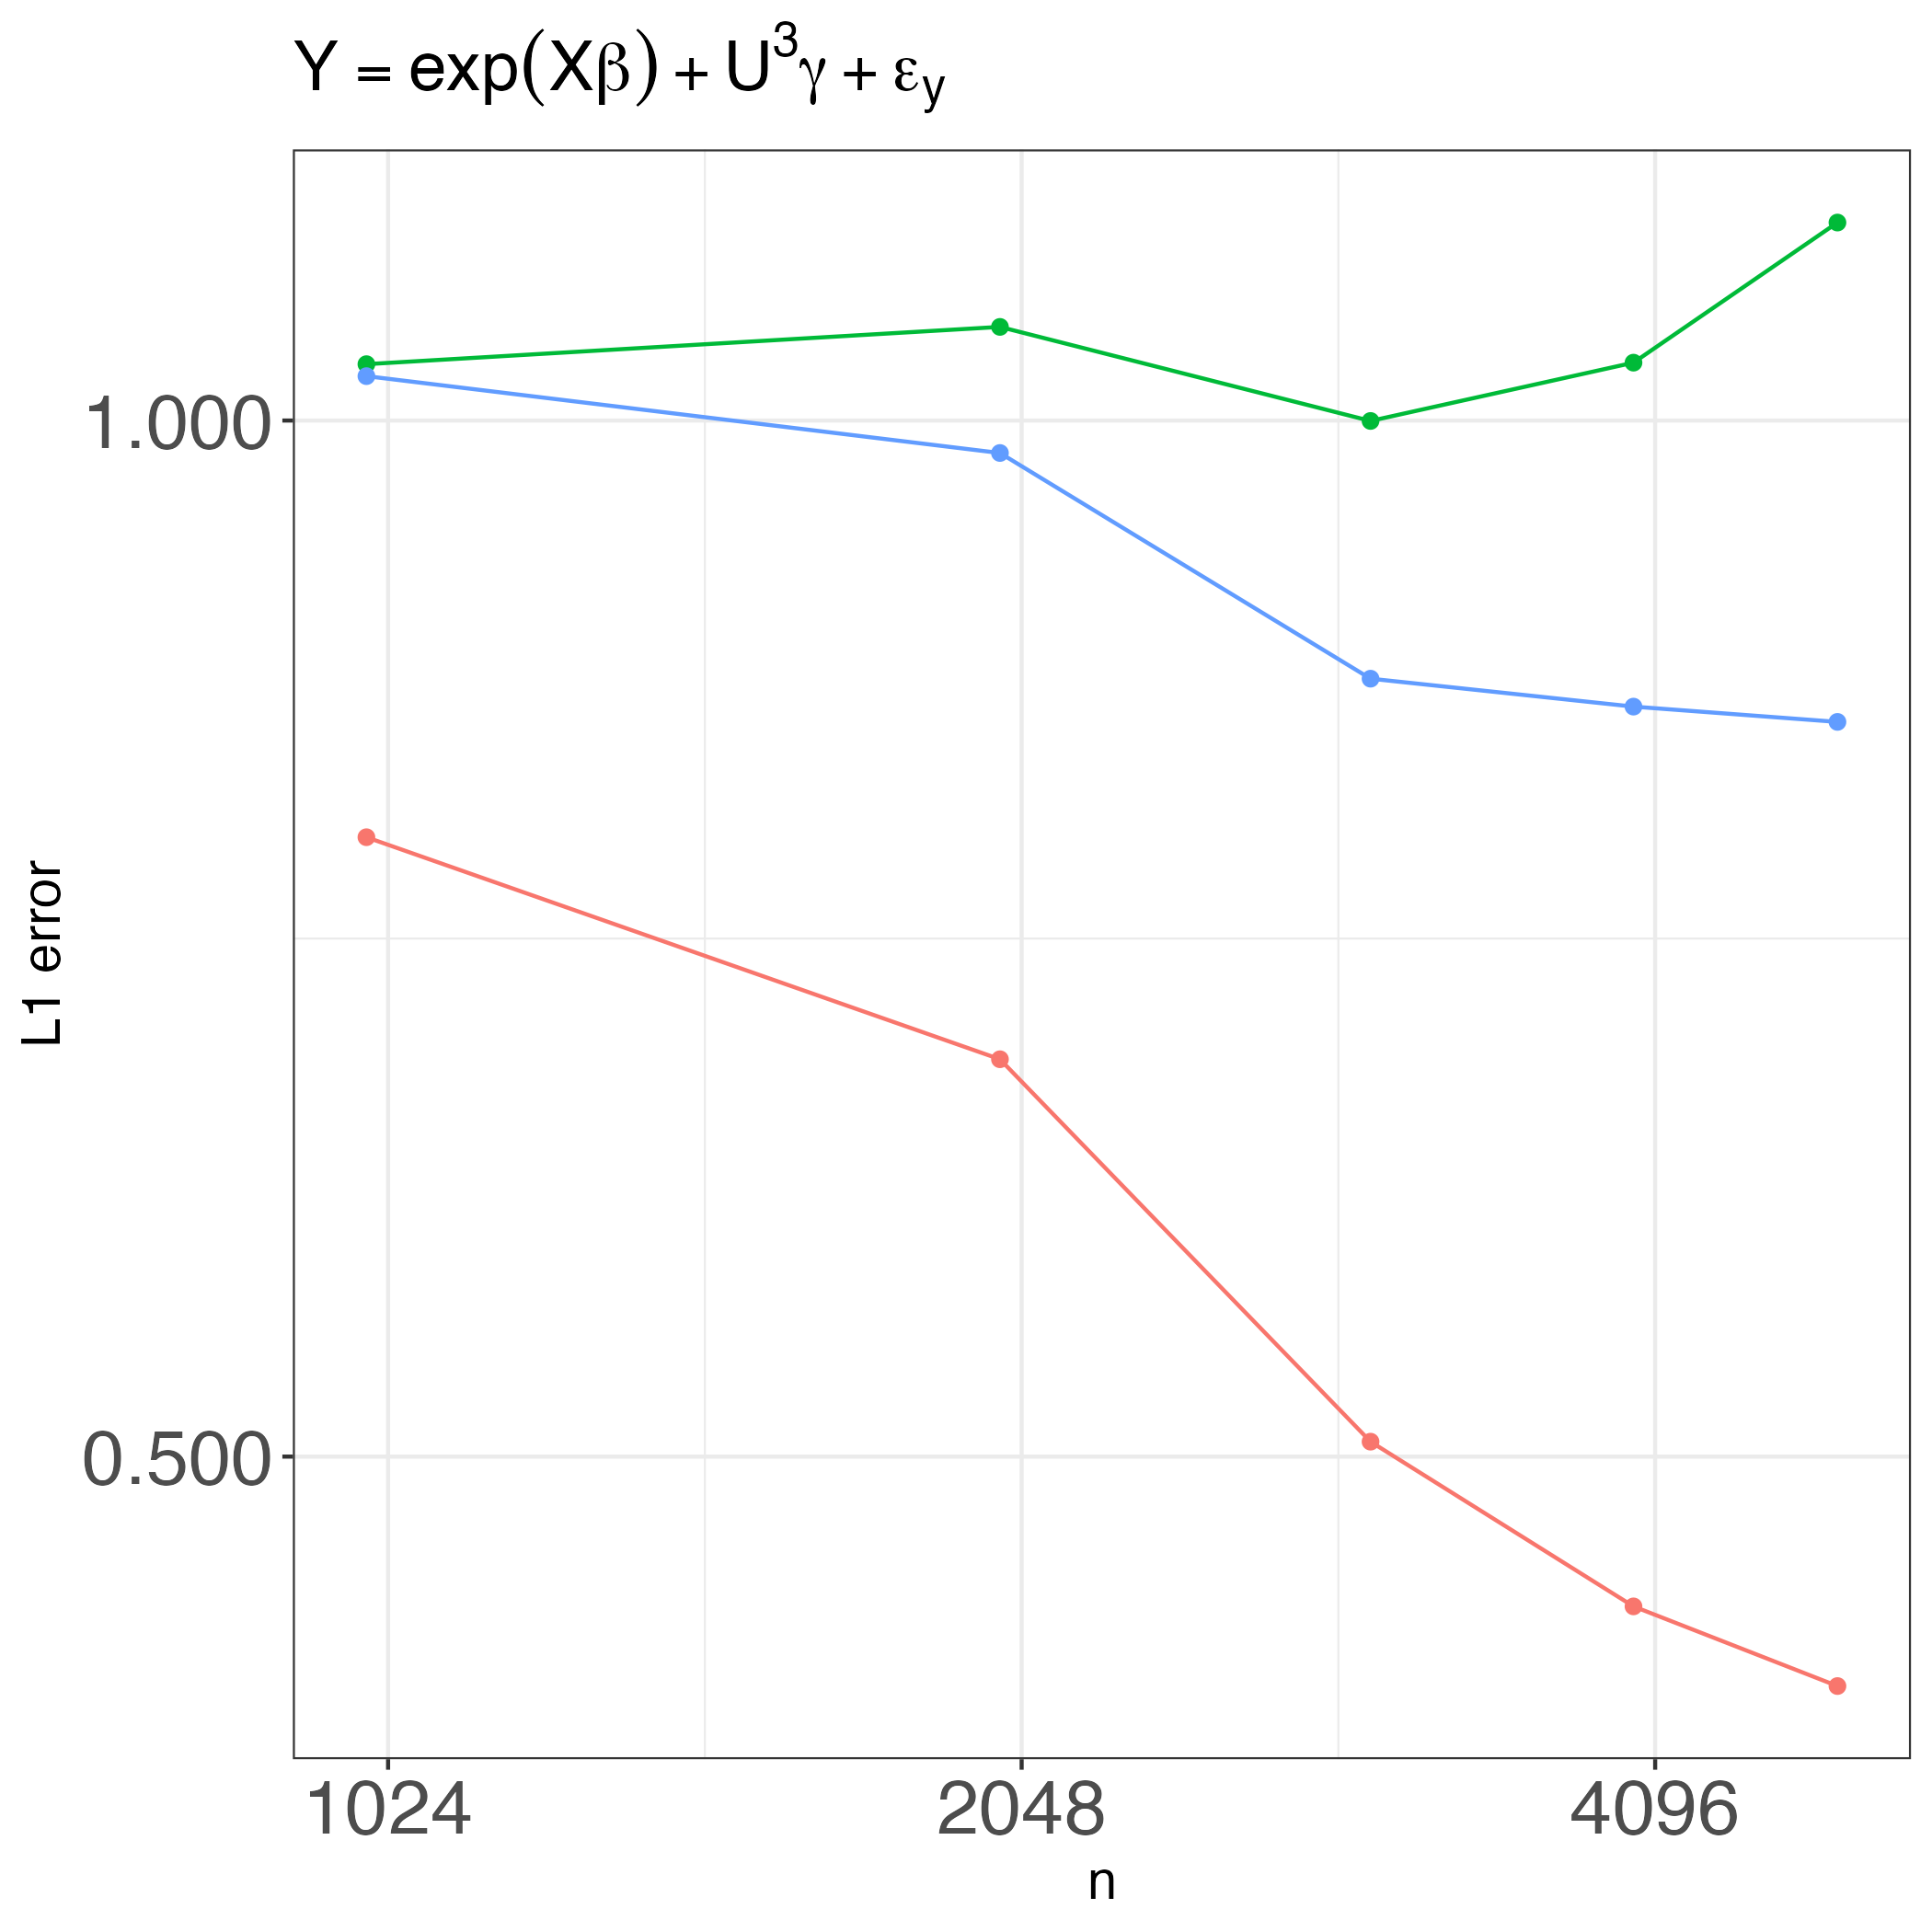
**Y = exp(Xβ) + U³γ + εγ**
## Axes
- **X-axis**: Labeled "n" with logarithmic scale markers at **1024**, **2048**, and **4096**.
- **Y-axis**: Labeled "L1 error" with values ranging from **0.500** to **1.000**.
## Legend
- **Location**: Top-right corner of the chart.
- **Color-Series Mapping**:
- **Green**: Represents the highest data series.
- **Blue**: Represents the second-highest data series.
- **Red**: Represents the lowest data series.
## Data Series Trends
1. **Green Line** (Highest Series):
- **Trend**: Starts at ~1.02 (n=1024), increases to ~1.03 (n=2048), dips to ~1.00 (n=4096), then sharply rises to ~1.05 (n=4096).
- **Key Points**:
- n=1024: ~1.02
- n=2048: ~1.03
- n=4096: ~1.05
2. **Blue Line** (Second-Highest Series):
- **Trend**: Starts at ~1.01 (n=1024), decreases steadily to ~0.99 (n=2048), then drops further to ~0.80 (n=4096).
- **Key Points**:
- n=1024: ~1.01
- n=2048: ~0.99
- n=4096: ~0.80
3. **Red Line** (Lowest Series):
- **Trend**: Starts at ~0.75 (n=1024), decreases to ~0.65 (n=2048), then sharply declines to ~0.40 (n=4096).
- **Key Points**:
- n=1024: ~0.75
- n=2048: ~0.65
- n=4096: ~0.40
## Spatial Grounding
- **Legend Position**: Top-right corner (coordinates: [x=right, y=top]).
- **Color Consistency**: All data points match their assigned legend colors (green, blue, red).
## Component Isolation
1. **Header**: Contains the equation title "Y = exp(Xβ) + U³γ + εγ".
2. **Main Chart**:
- Three distinct lines (green, blue, red) plotted against logarithmic x-axis and linear y-axis.
- Gridlines visible for reference.
3. **Footer**: No additional text or components.
## Verification
- **Trend Logic-Check**:
- Green line slopes upward overall, with a dip at n=2048.
- Blue line slopes downward consistently.
- Red line slopes downward sharply after n=2048.
- **Data Point Accuracy**: All extracted values align with visual trends and legend assignments.
## Conclusion
The chart illustrates three data series with distinct trends, governed by the equation **Y = exp(Xβ) + U³γ + εγ**. The green series exhibits the highest variability, while the red series shows the steepest decline. All data points and labels are explicitly extracted and cross-verified for accuracy.