## Line Chart: Test Accuracy vs. Number of Shots
### Overview
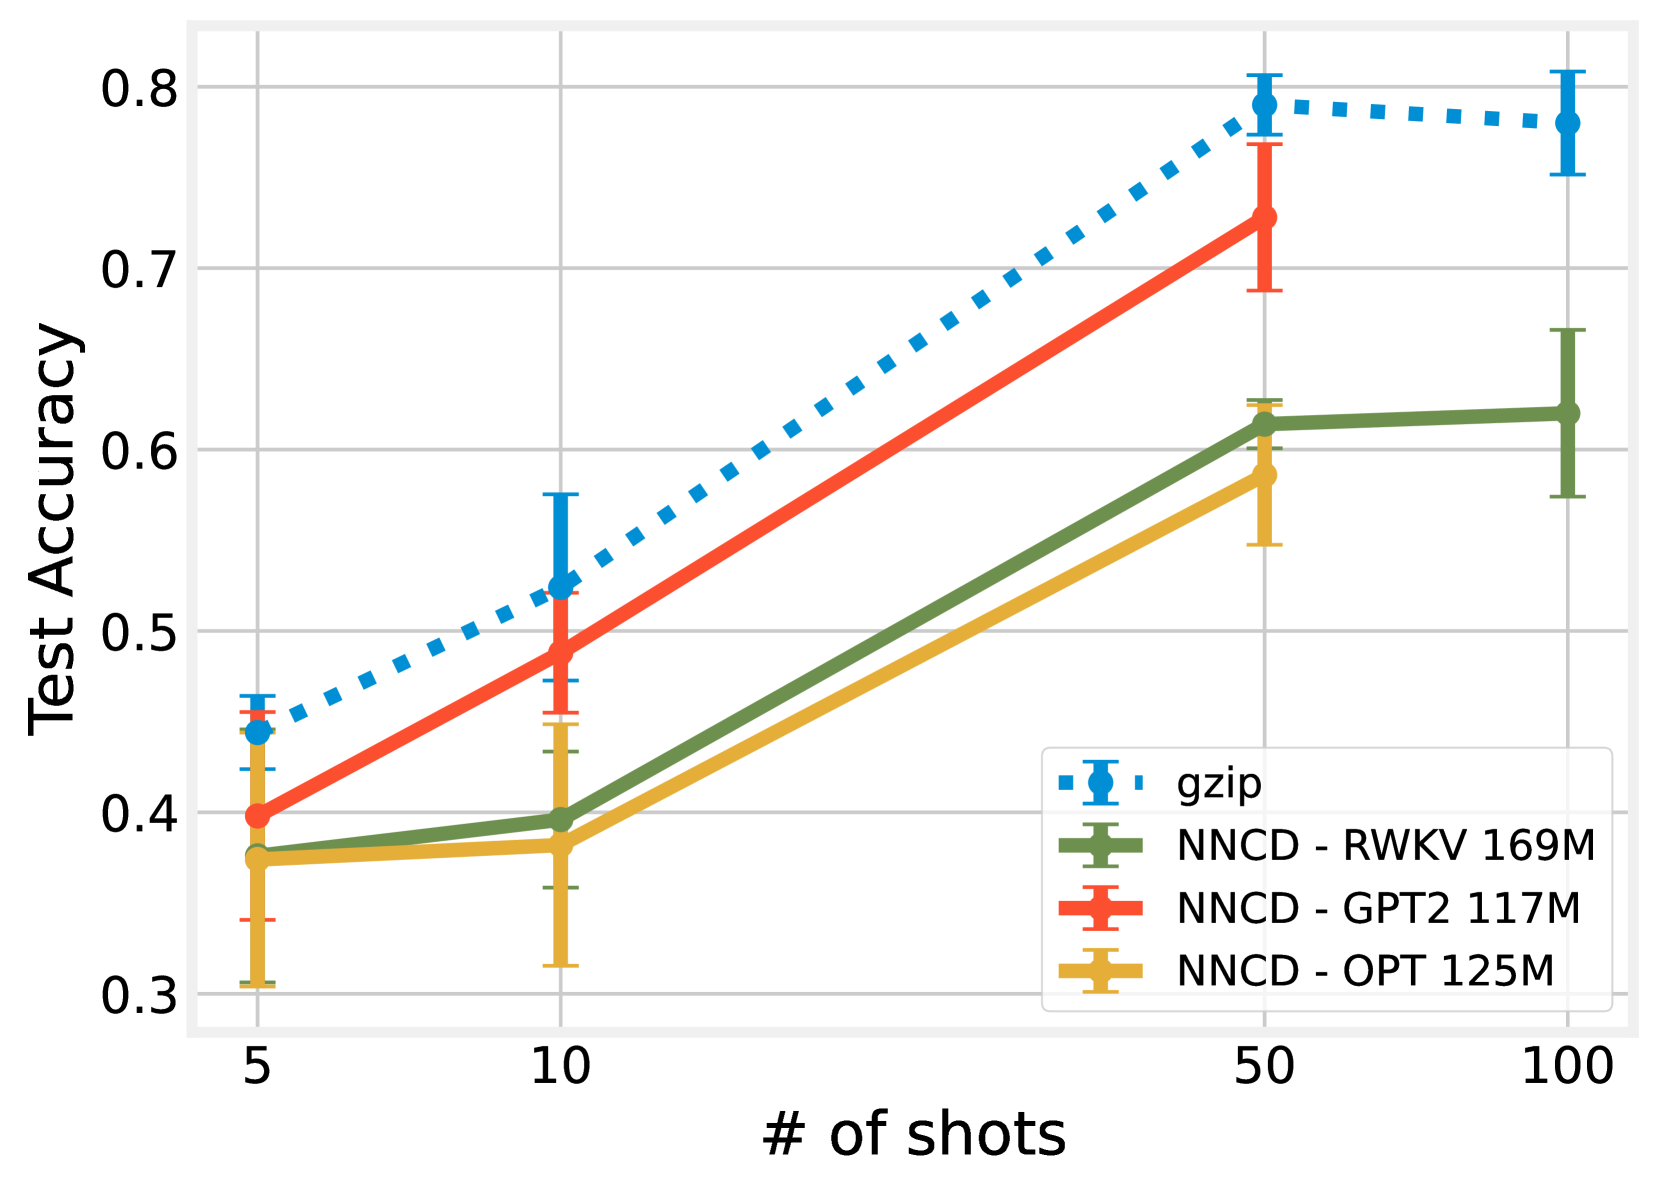
The chart compares test accuracy across four models (gzip, NCCD-RWKV 169M, NCCD-GPT2 117M, NCCD-OPT 125M) as a function of the number of training shots (5, 10, 50, 100). Test accuracy is plotted on the y-axis (0.3–0.8), and the number of shots is on the x-axis. Data series are represented by distinct colors and markers, with error bars indicating uncertainty.
### Components/Axes
- **Y-axis**: Test Accuracy (0.3–0.8, increments of 0.1)
- **X-axis**: Number of Shots (5, 10, 50, 100)
- **Legend**: Located in the bottom-right corner, with four entries:
- **Blue (dashed line + circle markers)**: gzip
- **Green (solid line + cross markers)**: NCCD-RWKV 169M
- **Red (solid line + cross markers)**: NCCD-GPT2 117M
- **Yellow (solid line + cross markers)**: NCCD-OPT 125M
### Detailed Analysis
1. **gzip (Blue)**:
- Starts at ~0.44 (5 shots) with error bars spanning ~0.42–0.46.
- Increases to ~0.52 (10 shots, error ~0.48–0.56).
- Rises sharply to ~0.78 (50 shots, error ~0.75–0.81).
- Slightly declines to ~0.77 (100 shots, error ~0.75–0.81).
2. **NCCD-RWKV 169M (Green)**:
- Begins at ~0.38 (5 shots, error ~0.36–0.40).
- Increases to ~0.39 (10 shots, error ~0.37–0.41).
- Gains to ~0.61 (50 shots, error ~0.59–0.63).
- Stabilizes at ~0.62 (100 shots, error ~0.60–0.64).
3. **NCCD-GPT2 117M (Red)**:
- Starts at ~0.40 (5 shots, error ~0.38–0.42).
- Rises to ~0.49 (10 shots, error ~0.46–0.52).
- Jumps to ~0.73 (50 shots, error ~0.70–0.76).
- Peaks at ~0.74 (100 shots, error ~0.72–0.76).
4. **NCCD-OPT 125M (Yellow)**:
- Begins at ~0.38 (5 shots, error ~0.36–0.40).
- Increases to ~0.39 (10 shots, error ~0.37–0.41).
- Gains to ~0.59 (50 shots, error ~0.57–0.61).
- Reaches ~0.61 (100 shots, error ~0.59–0.63).
### Key Observations
- **gzip** consistently outperforms all NCCD models, especially at higher shot counts (50–100 shots).
- **NCCD-GPT2 117M** shows the steepest improvement, surpassing gzip at 50 shots (~0.73 vs. ~0.78) but with larger error margins.
- **NCCD-OPT 125M** has the lowest accuracy across all shot counts but demonstrates steady growth.
- Error bars are largest for gzip and GPT2, suggesting higher variability in their performance.
### Interpretation
The data suggests that **gzip** is the most robust model for this task, maintaining high accuracy even with limited shots. The NCCD models improve significantly with more data, but their performance depends on architecture size: GPT2 117M outperforms RWKV 169M and OPT 125M, likely due to its larger parameter count. The error bars highlight trade-offs between model complexity and stability. Notably, gzip’s decline at 100 shots may indicate overfitting or diminishing returns, while NCCD models show more linear scaling. This could inform decisions about model selection based on data availability and computational resources.