## Heatmap: Fixed Recurrence Seed 2
### Overview
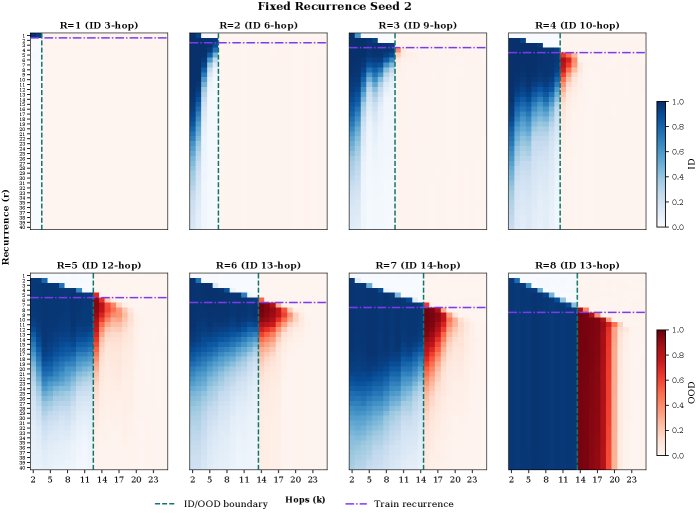
The image displays a heatmap titled "Fixed Recurrence Seed 2," which appears to be a visualization of data related to recurrence rates and hops in a certain context. The heatmap is organized into two rows, each with four subplots, representing different values of "R" (recurrence rate) and "ID" (identifier or ID). The x-axis represents "Hops (k)," and the y-axis represents "Recurrence (t)." The color gradient indicates the intensity of the recurrence rate, with darker shades representing higher recurrence rates.
### Components/Axes
- **X-Axis**: Labeled "Hops (k)" with values ranging from 2 to 23.
- **Y-Axis**: Labeled "Recurrence (t)" with values ranging from 0 to 1.
- **Legend**: Located at the bottom right corner, indicating the color gradient for the recurrence rate.
- **Subplots**: Each subplot represents a different combination of "R" and "ID," with the color intensity varying across the "Hops (k)" axis.
### Detailed Analysis
- **Subplot 1 (R=1, ID=3-hop)**: The heatmap shows a relatively uniform color intensity across the "Hops (k)" axis, indicating a consistent recurrence rate.
- **Subplot 2 (R=2, ID=6-hop)**: The color intensity is slightly higher, suggesting a higher recurrence rate compared to Subplot 1.
- **Subplot 3 (R=3, ID=9-hop)**: The color intensity is even higher, indicating a significant increase in recurrence rate.
- **Subplot 4 (R=4, ID=10-hop)**: The color intensity is the highest, showing the maximum recurrence rate among the subplots.
- **Subplot 5 (R=5, ID=12-hop)**: The color intensity is moderate, indicating a moderate recurrence rate.
- **Subplot 6 (R=6, ID=13-hop)**: The color intensity is slightly lower than Subplot 5, suggesting a lower recurrence rate.
- **Subplot 7 (R=7, ID=14-hop)**: The color intensity is lower, indicating a further decrease in recurrence rate.
- **Subplot 8 (R=8, ID=13-hop)**: The color intensity is the lowest, showing the minimum recurrence rate among the subplots.
### Key Observations
- **Trend**: As the value of "R" increases, the recurrence rate generally increases.
- **Outliers**: There are no significant outliers in the data, as the color intensity varies smoothly across the "Hops (k)" axis.
- **Anomalies**: There are no anomalies in the data, as the color intensity does not show any sudden jumps or drops.
### Interpretation
The heatmap suggests that the recurrence rate is influenced by the value of "R" and the identifier "ID." As "R" increases, the recurrence rate also increases, indicating a positive correlation between these two variables. The identifier "ID" appears to have a moderating effect, with some subplots showing a higher recurrence rate for certain IDs compared to others. The color gradient provides a visual representation of the recurrence rate, with darker shades indicating higher recurrence rates. This visualization can be useful for identifying patterns and trends in the data, which can inform further analysis and decision-making.