## Diagram: Feasible and Infeasible Sound Source Localization
### Overview
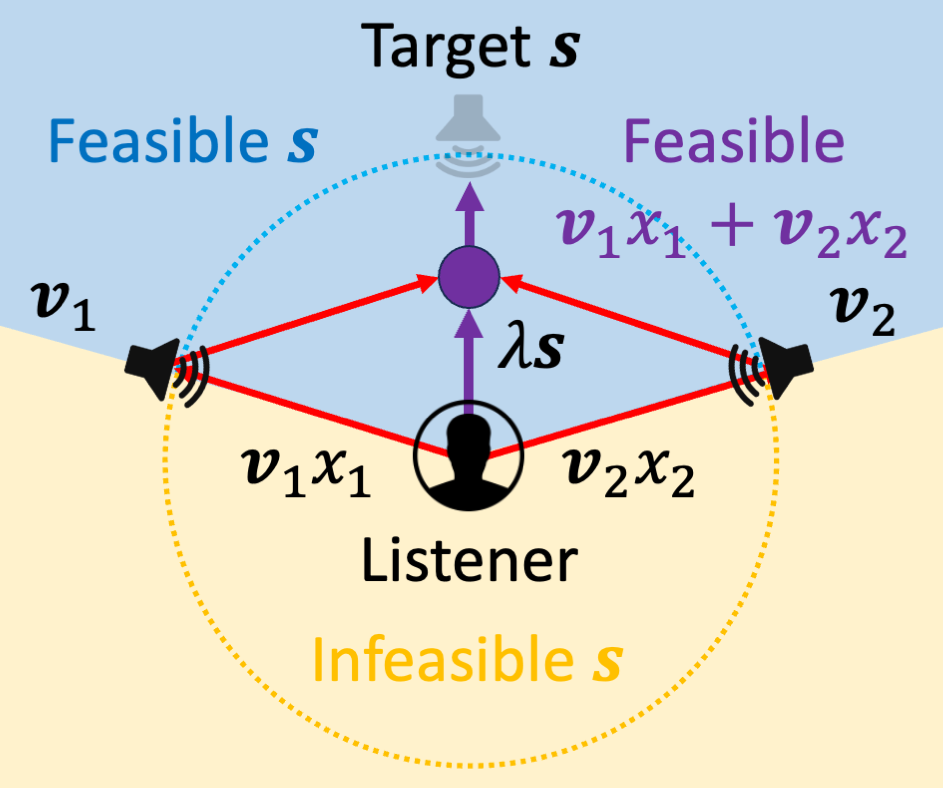
The image is a diagram illustrating the concept of feasible and infeasible sound source localization. It depicts a listener, two sound sources (speakers), a target sound source, and regions indicating where sound source localization is feasible or infeasible. The diagram uses arrows and labels to show the relationships between these elements.
### Components/Axes
* **Target s:** Located at the top-center of the diagram, represented by a speaker icon.
* **Listener:** Located at the bottom-center of the diagram, represented by a silhouette of a person.
* **Speakers (v1, v2):** Two speakers are positioned on the left and right sides of the diagram.
* **v1:** Left speaker.
* **v2:** Right speaker.
* **Feasible s (Blue):** The region above the dotted blue arc, indicating where sound source localization is feasible.
* **Infeasible s (Yellow):** The region below the dotted yellow arc, indicating where sound source localization is infeasible.
* **λs:** A purple arrow pointing from the listener to a purple dot.
* **v1x1 + v2x2:** Purple text above the purple dot.
* **v1x1:** Red line from the left speaker to the listener.
* **v2x2:** Red line from the right speaker to the listener.
* **Dotted Blue Arc:** Separates the "Feasible s" region from the "Infeasible s" region.
* **Dotted Yellow Arc:** Separates the "Feasible s" region from the "Infeasible s" region.
### Detailed Analysis
* **Listener to Target:** The listener is positioned below the target sound source.
* **Speakers:** The two speakers are positioned on either side of the listener.
* **Feasible Region:** The feasible region is above the dotted blue arc, encompassing the target sound source. The text "Feasible s" is written in blue in this region.
* **Infeasible Region:** The infeasible region is below the dotted yellow arc, encompassing the listener. The text "Infeasible s" is written in yellow in this region.
* **Arrows:**
* Red arrows connect each speaker to the listener, labeled as "v1x1" and "v2x2" respectively.
* Red arrows connect each speaker to the purple dot, labeled as "v1x1" and "v2x2" respectively.
* A purple arrow connects the listener to the purple dot, labeled as "λs".
* A purple arrow connects the purple dot to the target speaker.
* **Purple Dot:** Located between the listener and the target speaker, with the label "v1x1 + v2x2" above it.
### Key Observations
* The diagram illustrates the concept of feasible and infeasible regions for sound source localization.
* The position of the listener, speakers, and target sound source are key elements in determining the feasibility of localization.
* The dotted arcs visually separate the feasible and infeasible regions.
* The arrows and labels indicate the relationships between the different elements in the diagram.
### Interpretation
The diagram demonstrates a simplified model of sound source localization. The "Feasible s" region represents areas where the sound source can be accurately localized, while the "Infeasible s" region represents areas where localization is difficult or impossible. The position of the listener relative to the sound sources and the target plays a crucial role in determining the feasibility of localization. The variables v1, v2, x1, x2, and λ likely represent parameters related to the sound signals and spatial relationships, but without further context, their precise meaning is unclear. The purple dot likely represents a calculated or estimated location of the sound source based on the signals received by the listener. The diagram suggests that accurate sound source localization depends on the listener being positioned within a region where the sound signals from the speakers can be effectively processed.