\n
## Diagram: Acoustic Localization Feasibility
### Overview
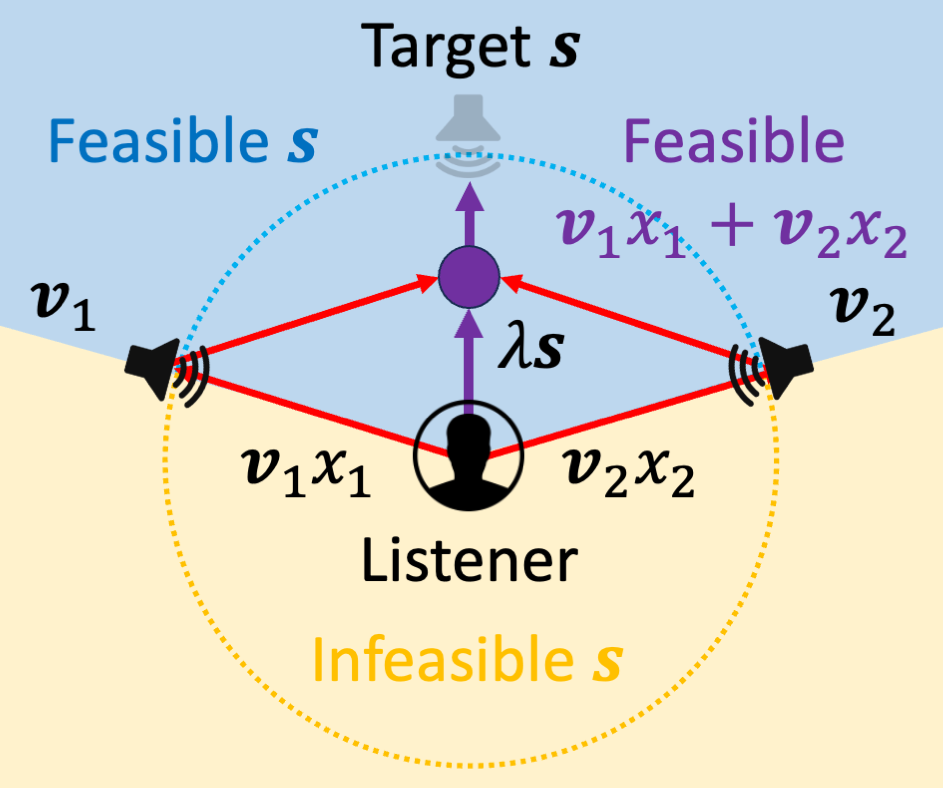
This diagram illustrates the feasibility of acoustic localization based on the relative positions of two sound sources (speakers), a listener, and the target location. It uses concentric dotted circles to represent regions of feasible and infeasible localization, determined by the speed of sound and the distances involved.
### Components/Axes
The diagram features the following components:
* **Target s:** Located at the top-center of the diagram.
* **Listener:** Positioned at the center of the diagram.
* **Speaker 1 (v₁):** Located on the left side of the diagram.
* **Speaker 2 (v₂):** Located on the right side of the diagram.
* **Feasible s:** A region above the listener, indicated by a blue dotted circle.
* **Infeasible s:** A region below the listener, indicated by a yellow dotted circle.
* **λs:** A purple arrow pointing upwards from the listener towards the target.
* **v₁x₁:** A purple arrow pointing from Speaker 1 towards the target.
* **v₂x₂:** A purple arrow pointing from Speaker 2 towards the target.
* **v₁x₁ + v₂x₂:** A purple arrow representing the vector sum of v₁x₁ and v₂x₂ pointing towards the target.
### Detailed Analysis / Content Details
The diagram depicts a scenario where two speakers (v₁ and v₂) are attempting to localize a target 's' relative to a listener. The feasibility of localization is determined by the geometry of the sound paths.
* **Speaker 1 (v₁):** Positioned approximately 45 degrees to the left of the vertical axis.
* **Speaker 2 (v₂):** Positioned approximately 45 degrees to the right of the vertical axis.
* **Target s:** Directly above the listener.
* **Feasible s:** The blue dotted circle encompasses the area above the listener where localization is considered feasible. The radius of this circle is approximately 1.5 times the distance from the listener to either speaker.
* **Infeasible s:** The yellow dotted circle encompasses the area below the listener where localization is considered infeasible. The radius of this circle is approximately 0.75 times the distance from the listener to either speaker.
* **λs:** Represents the wavelength of the sound multiplied by the distance to the target.
* **v₁x₁:** Represents the component of the velocity of sound from Speaker 1 in the direction of the target.
* **v₂x₂:** Represents the component of the velocity of sound from Speaker 2 in the direction of the target.
* **v₁x₁ + v₂x₂:** Represents the vector sum of the velocity components from both speakers, indicating the combined effect of their signals on the target.
### Key Observations
* The diagram highlights a geometric constraint on acoustic localization.
* Localization is feasible in the region above the listener (Feasible s) and infeasible below (Infeasible s).
* The vector sum of the sound paths from the two speakers (v₁x₁ + v₂x₂) points directly towards the target.
### Interpretation
The diagram illustrates a fundamental principle in acoustic localization: the accuracy of localization depends on the relative positions of the sound sources, the listener, and the target. The feasible and infeasible regions are defined by the constructive and destructive interference patterns of the sound waves. The diagram suggests that localization is more accurate when the target is located in a region where the sound waves from the two speakers arrive in phase (Feasible s). Conversely, localization is less accurate when the sound waves arrive out of phase (Infeasible s). The use of vectors (v₁x₁, v₂x₂, v₁x₁ + v₂x₂) emphasizes the importance of considering the direction and magnitude of the sound waves in determining the target's location. This diagram is a simplified representation of a complex phenomenon, but it effectively conveys the key geometric constraints on acoustic localization.