## Line Chart: MSE Loss, Kendall, and Overlap Rate vs. Step
### Overview
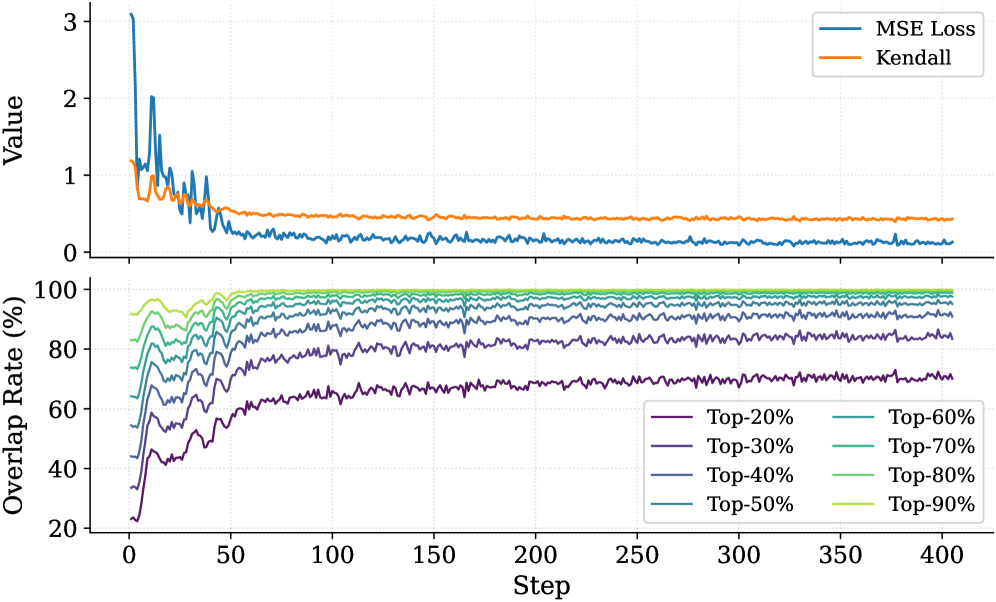
The image presents two line charts stacked vertically. The top chart displays the MSE Loss and Kendall values against the step number. The bottom chart shows the overlap rate (%) for different top percentages (20% to 90%) against the step number. Both charts share the same x-axis (Step).
### Components/Axes
**Top Chart:**
* **Title:** Value vs. Step
* **Y-axis Label:** Value
* **Y-axis Scale:** 0 to 3, with tick marks at 0, 1, 2, and 3.
* **X-axis Label:** Step (shared with the bottom chart)
* **Legend (Top-Right):**
* Blue line: MSE Loss
* Orange line: Kendall
**Bottom Chart:**
* **Title:** Overlap Rate (%) vs. Step
* **Y-axis Label:** Overlap Rate (%)
* **Y-axis Scale:** 20 to 100, with tick marks at 20, 40, 60, 80, and 100.
* **X-axis Label:** Step
* **X-axis Scale:** 0 to 400, with tick marks at intervals of 50 (0, 50, 100, 150, 200, 250, 300, 350, 400).
* **Legend (Bottom-Right):**
* Dark Purple: Top-20%
* Purple: Top-30%
* Dark Blue: Top-40%
* Light Blue: Top-50%
* Teal: Top-60%
* Green: Top-70%
* Light Green: Top-80%
* Yellow-Green: Top-90%
### Detailed Analysis
**Top Chart:**
* **MSE Loss (Blue):** Starts at approximately 3, rapidly decreases to around 0.2 within the first 50 steps, and then fluctuates around 0.2 for the remaining steps.
* **Kendall (Orange):** Starts at approximately 1.2, decreases to around 0.5 within the first 50 steps, and then remains relatively stable around 0.5 for the remaining steps.
**Bottom Chart:**
* **Top-20% (Dark Purple):** Starts at approximately 20%, increases to around 65% within the first 100 steps, and then fluctuates around 65% for the remaining steps.
* **Top-30% (Purple):** Starts at approximately 22%, increases to around 75% within the first 100 steps, and then fluctuates around 75% for the remaining steps.
* **Top-40% (Dark Blue):** Starts at approximately 25%, increases to around 82% within the first 100 steps, and then fluctuates around 82% for the remaining steps.
* **Top-50% (Light Blue):** Starts at approximately 30%, increases to around 88% within the first 100 steps, and then fluctuates around 88% for the remaining steps.
* **Top-60% (Teal):** Starts at approximately 35%, increases to around 92% within the first 100 steps, and then fluctuates around 92% for the remaining steps.
* **Top-70% (Green):** Starts at approximately 40%, increases to around 95% within the first 100 steps, and then fluctuates around 95% for the remaining steps.
* **Top-80% (Light Green):** Starts at approximately 42%, increases to around 97% within the first 100 steps, and then fluctuates around 97% for the remaining steps.
* **Top-90% (Yellow-Green):** Starts at approximately 45%, increases to around 98% within the first 100 steps, and then fluctuates around 98% for the remaining steps.
### Key Observations
* Both MSE Loss and Kendall values decrease significantly in the initial steps and then stabilize.
* The overlap rate for all top percentages increases rapidly in the initial steps and then stabilizes.
* Higher top percentages generally have higher overlap rates.
* The most significant changes in both charts occur within the first 100 steps.
### Interpretation
The charts illustrate the training process of a model, likely related to ranking or information retrieval. The MSE Loss and Kendall values in the top chart indicate the model's error and ranking correlation, respectively. The decrease in these values suggests that the model is learning and improving its performance.
The bottom chart shows the overlap rate between the top-ranked items predicted by the model and the ground truth. The increasing overlap rates for different top percentages indicate that the model is becoming more accurate in identifying the most relevant items. The higher overlap rates for higher top percentages suggest that the model is better at ranking the most relevant items at the top of the list.
The stabilization of both charts after the first 100 steps suggests that the model has reached a point of diminishing returns, where further training may not significantly improve its performance.