## Line Chart: Training Metrics
### Overview
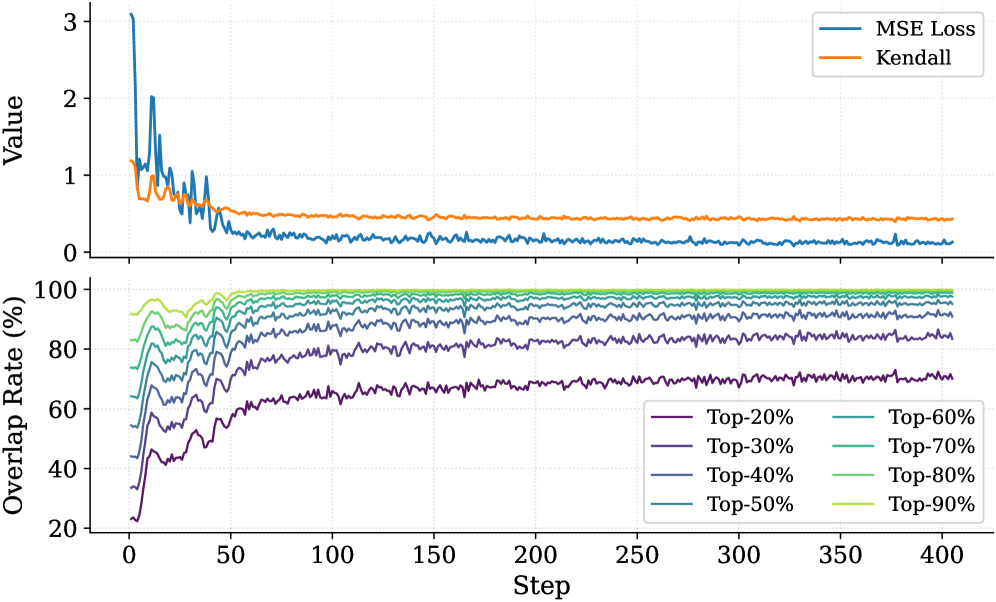
The image presents a line chart displaying training metrics over 400 steps. The chart consists of two subplots: the top subplot shows the MSE Loss and Kendall's Tau correlation, while the bottom subplot displays the Overlap Rate for different percentile thresholds (Top-20%, Top-30%, etc.).
### Components/Axes
* **X-axis (both subplots):** Step (ranging from 0 to 400)
* **Y-axis (top subplot):** Value (ranging from 0 to 3)
* **Y-axis (bottom subplot):** Overlap Rate (%) (ranging from 0 to 100)
* **Legend (top-right):**
* Blue Line: MSE Loss
* Orange Line: Kendall
* **Legend (bottom-right):**
* Dark Gray Line: Top-20%
* Purple Line: Top-30%
* Teal Line: Top-40%
* Green Line: Top-50%
* Light Blue Line: Top-60%
* Dark Teal Line: Top-70%
* Light Green Line: Top-80%
* Magenta Line: Top-90%
### Detailed Analysis
**Top Subplot (MSE Loss & Kendall's Tau):**
* **MSE Loss (Blue Line):** The MSE Loss starts at approximately 2.8 and rapidly decreases to around 0.1 within the first 50 steps. After that, it fluctuates around 0.05-0.1 with minor oscillations until step 400.
* **Kendall (Orange Line):** Kendall's Tau starts at approximately 0.9 and decreases to around 0.6 within the first 50 steps. It then plateaus around 0.65-0.75 with slight variations until step 400.
**Bottom Subplot (Overlap Rate):**
* **Top-20% (Dark Gray Line):** Starts at approximately 20% and increases to around 85% by step 50. It then fluctuates between 80% and 90% for the remainder of the steps.
* **Top-30% (Purple Line):** Starts at approximately 20% and increases to around 80% by step 50. It then fluctuates between 75% and 85% for the remainder of the steps.
* **Top-40% (Teal Line):** Starts at approximately 20% and increases to around 75% by step 50. It then fluctuates between 70% and 80% for the remainder of the steps.
* **Top-50% (Green Line):** Starts at approximately 20% and increases to around 70% by step 50. It then fluctuates between 65% and 75% for the remainder of the steps.
* **Top-60% (Light Blue Line):** Starts at approximately 20% and increases to around 65% by step 50. It then fluctuates between 60% and 70% for the remainder of the steps.
* **Top-70% (Dark Teal Line):** Starts at approximately 20% and increases to around 60% by step 50. It then fluctuates between 55% and 65% for the remainder of the steps.
* **Top-80% (Light Green Line):** Starts at approximately 20% and increases to around 55% by step 50. It then fluctuates between 50% and 60% for the remainder of the steps.
* **Top-90% (Magenta Line):** Starts at approximately 20% and increases to around 50% by step 50. It then fluctuates between 45% and 55% for the remainder of the steps.
### Key Observations
* Both MSE Loss and Kendall's Tau converge relatively quickly within the first 50 steps.
* The Overlap Rate increases rapidly for all percentile thresholds within the first 50 steps and then plateaus.
* Higher percentile thresholds (e.g., Top-20%) exhibit higher overlap rates compared to lower percentile thresholds (e.g., Top-90%).
* The overlap rate curves appear to be converging as the number of steps increases.
### Interpretation
The chart demonstrates the training progress of a model. The rapid decrease in MSE Loss and increase in Overlap Rate within the initial steps indicate that the model is learning quickly. The convergence of both metrics suggests that the training process is stabilizing. The different overlap rates for various percentile thresholds likely reflect the model's ability to accurately rank or predict outcomes for different levels of confidence. The higher overlap rates for the top percentiles suggest that the model is more confident and accurate in its predictions for the most likely outcomes. The plateauing of the metrics after 50 steps suggests that the model has reached a point of diminishing returns and further training may not significantly improve performance. The Kendall's Tau metric provides a measure of rank correlation, and its convergence indicates that the model is learning to correctly order the predicted outcomes.