## Line Chart: Model Performance Metrics
### Overview
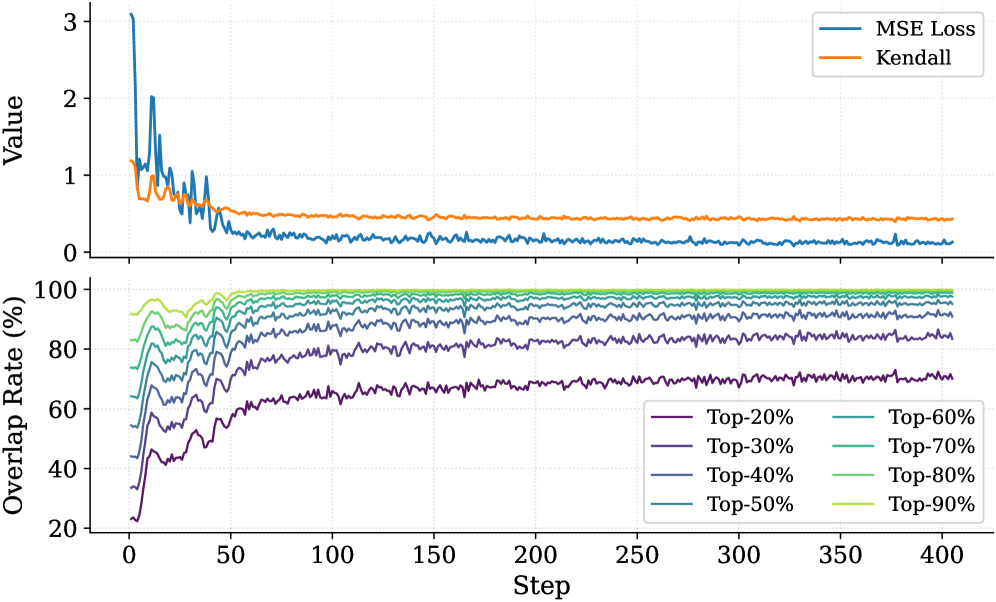
The image contains two stacked line graphs. The top graph shows two metrics (MSE Loss and Kendall) over 400 steps, while the bottom graph displays multiple overlapping lines representing percentile-based overlap rates. Both graphs share the same x-axis ("Step") but have distinct y-axes.
### Components/Axes
**Top Graph:**
- **X-axis (Step):** 0 to 400 (linear scale)
- **Y-axis (Value):** 0 to 3 (linear scale)
- **Legend:** Top-right corner
- Blue line: MSE Loss
- Orange line: Kendall
**Bottom Graph:**
- **X-axis (Step):** 0 to 400 (linear scale)
- **Y-axis (Overlap Rate %):** 20 to 100 (linear scale)
- **Legend:** Top-right corner
- Purple: Top-20%
- Teal: Top-30%
- Blue: Top-40%
- Green: Top-50%
- Light blue: Top-60%
- Yellow: Top-70%
- Dark blue: Top-80%
- Light green: Top-90%
### Detailed Analysis
**Top Graph Trends:**
1. **MSE Loss (Blue):**
- Starts at ~3.0 at step 0
- Sharp decline to ~0.2 by step 50
- Minor fluctuations between 0.1-0.3 from step 100-400
- Peak value: 3.0 (step 0)
- Final value: ~0.2 (step 400)
2. **Kendall (Orange):**
- Starts at ~0.8 at step 0
- Small spike to ~1.2 at step 25
- Stabilizes at ~0.8-0.9 from step 50-400
- Peak value: 1.2 (step 25)
- Final value: ~0.85 (step 400)
**Bottom Graph Trends:**
- All lines show gradual upward trends until ~step 100, then flatten
- **Top-20% (Purple):**
- Starts at 20% (step 0)
- Rises to ~65% by step 100
- Final value: ~75% (step 400)
- **Top-90% (Light Green):**
- Starts at 90% (step 0)
- Rises to ~98% by step 100
- Final value: ~99% (step 400)
- All lines converge toward similar values by step 400
### Key Observations
1. MSE Loss shows rapid initial improvement, stabilizing at low values
2. Kendall metric remains relatively stable after initial volatility
3. Overlap rates demonstrate consistent improvement across all percentiles
4. Higher percentile lines (Top-70% to Top-90%) maintain >90% overlap throughout
5. All metrics show minimal change after step 200
### Interpretation
The data suggests a model training process with:
- **Rapid initial learning** (evidenced by MSE Loss drop from 3.0 to 0.2 in first 50 steps)
- **Stable performance** in later stages (both metrics plateau after step 100)
- **Consistent coverage improvement** across all performance percentiles
- **Diminishing returns** after step 200, as all metrics stabilize
The convergence of overlap rates toward similar values by step 400 implies the model achieves comparable performance across different evaluation thresholds. The Kendall metric's stability suggests consistent ranking performance, while the MSE Loss indicates successful error minimization. The overlap rate patterns may reflect the model's ability to maintain performance across different confidence intervals or evaluation criteria.