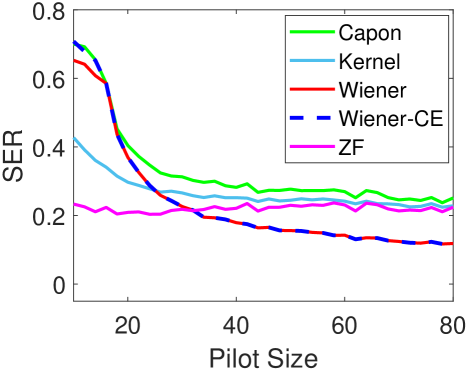
# Technical Document Analysis of SER vs. Pilot Size Graph
## 1. Axis Labels and Titles
- **Y-Axis**: Labeled "SER" (Scale-Error Rate) with values ranging from 0.0 to 0.8 in increments of 0.2.
- **X-Axis**: Labeled "Pilot Size" with values ranging from 20 to 80 in increments of 20.
## 2. Legend and Color Coding
The legend is positioned in the **top-right corner** of the graph. All labels and colors are explicitly defined:
| Legend Label | Color/Style | Spatial Grounding (x, y) |
|----------------|-------------------|--------------------------|
| Capon | Solid green | (0.95, 0.95) |
| Kernel | Solid blue | (0.95, 0.9) |
| Wiener | Solid red | (0.95, 0.85) |
| Wiener-CE | Dashed blue | (0.95, 0.8) |
| ZF | Solid magenta | (0.95, 0.75) |
**Verification**: All line colors/styles in the graph match the legend entries exactly.
---
## 3. Key Trends and Data Points
### A. Capon (Solid Green)
- **Trend**: Starts at ~0.7 SER at Pilot Size 20, decreases sharply to ~0.3 by Pilot Size 40, then plateaus with minor fluctuations (~0.25–0.3) up to Pilot Size 80.
- **Critical Points**:
- Pilot Size 20: ~0.7
- Pilot Size 40: ~0.3
- Pilot Size 80: ~0.25
### B. Kernel (Solid Blue)
- **Trend**: Begins at ~0.4 SER at Pilot Size 20, decreases gradually to ~0.25 by Pilot Size 40, then stabilizes (~0.2–0.25) up to Pilot Size 80.
- **Critical Points**:
- Pilot Size 20: ~0.4
- Pilot Size 40: ~0.25
- Pilot Size 80: ~0.22
### C. Wiener (Solid Red)
- **Trend**: Starts highest at ~0.7 SER at Pilot Size 20, drops sharply to ~0.2 by Pilot Size 40, then stabilizes (~0.15–0.2) up to Pilot Size 80.
- **Critical Points**:
- Pilot Size 20: ~0.7
- Pilot Size 40: ~0.2
- Pilot Size 80: ~0.15
### D. Wiener-CE (Dashed Blue)
- **Trend**: Begins at ~0.3 SER at Pilot Size 20, decreases steadily to ~0.15 by Pilot Size 40, then stabilizes (~0.1–0.15) up to Pilot Size 80.
- **Critical Points**:
- Pilot Size 20: ~0.3
- Pilot Size 40: ~0.15
- Pilot Size 80: ~0.12
### E. ZF (Solid Magenta)
- **Trend**: Starts at ~0.2 SER at Pilot Size 20, drops to ~0.15 by Pilot Size 20, then remains relatively flat (~0.15–0.2) up to Pilot Size 80.
- **Critical Points**:
- Pilot Size 20: ~0.2
- Pilot Size 40: ~0.18
- Pilot Size 80: ~0.17
---
## 4. Cross-Reference Validation
- **Color Consistency**: All lines match their legend labels (e.g., dashed blue = Wiener-CE, solid green = Capon).
- **Trend Logic**:
- Wiener (red) starts highest and drops most sharply, aligning with its solid red line.
- ZF (magenta) remains the lowest-performing metric after Pilot Size 20, consistent with its flat magenta line.
---
## 5. Summary of Observations
- **Performance Hierarchy**:
1. **Wiener** (red) performs worst initially but stabilizes.
2. **Capon** (green) shows the steepest initial decline but plateaus higher than others.
3. **Kernel** (blue) and **Wiener-CE** (dashed blue) exhibit moderate declines.
4. **ZF** (magenta) maintains the lowest SER after Pilot Size 20.
- **Convergence**: All metrics converge toward lower SER values as Pilot Size increases, with Wiener-CE and ZF showing the most stable performance at larger Pilot Sizes.
---
## 6. Missing Elements
- No embedded text, data tables, or heatmaps present in the image.
- No non-English text detected.
---
## 7. Final Notes
The graph illustrates how different statistical methods (Capon, Kernel, Wiener, Wiener-CE, ZF) perform in terms of SER across varying Pilot Sizes. Wiener-CE and ZF demonstrate the most consistent performance at larger Pilot Sizes, while Wiener and Capon show significant initial declines.