## Medical Risk Assessment Report: Heart Disease Probability Analysis
### Overview
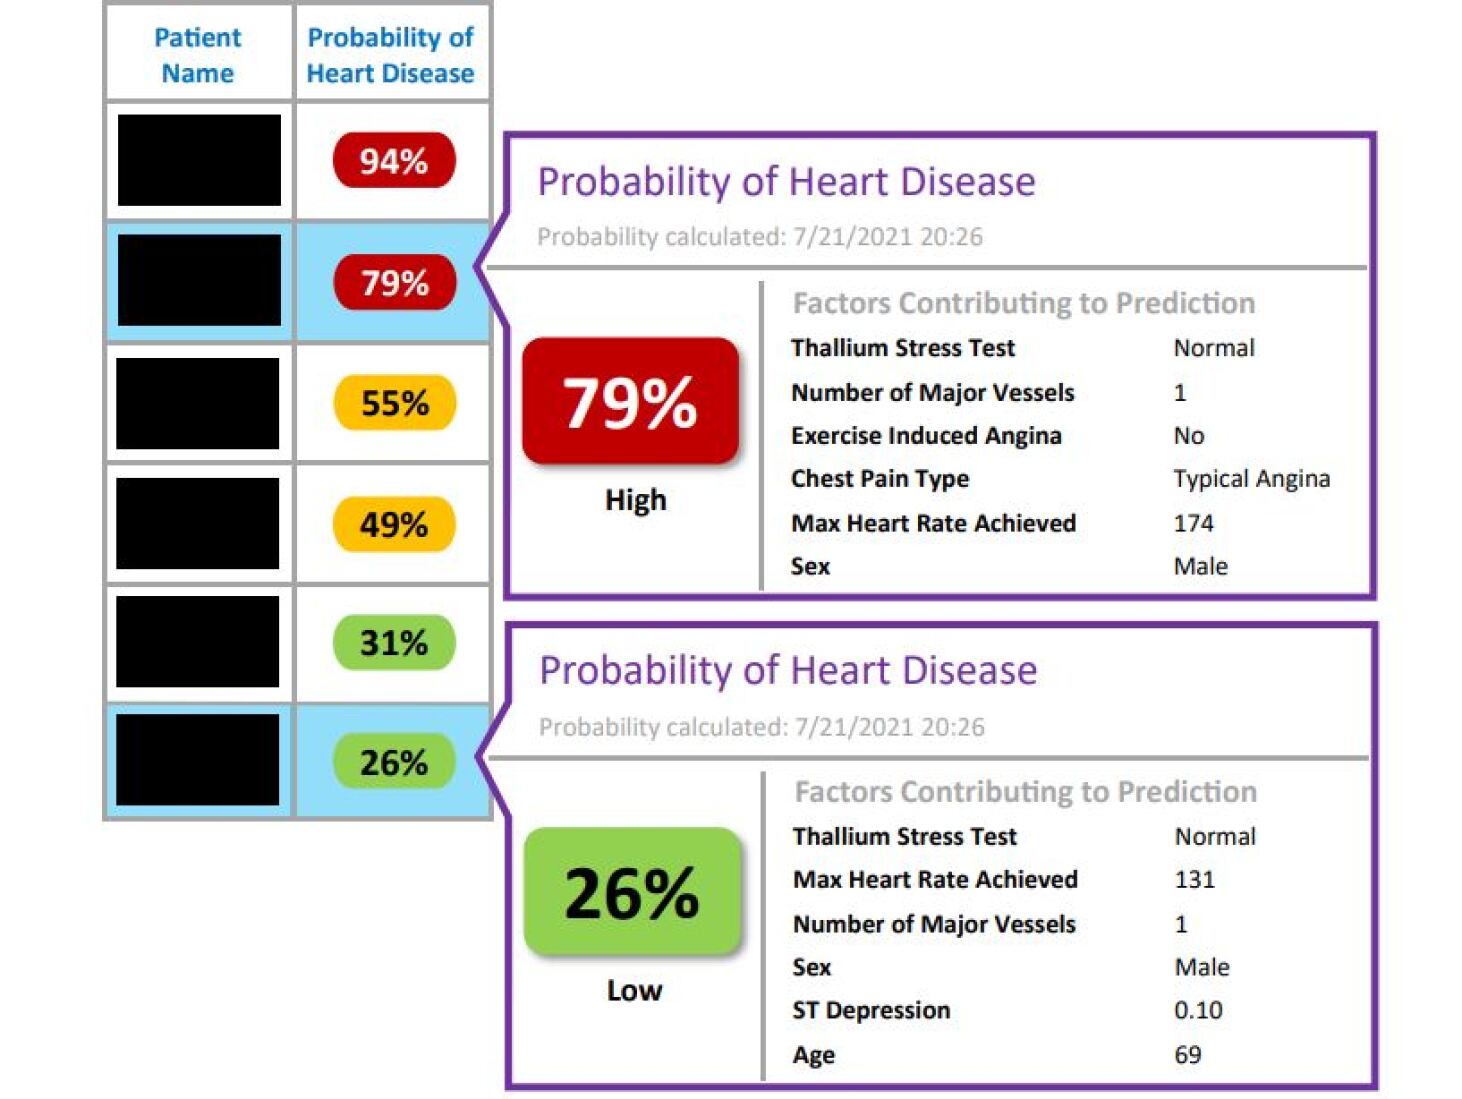
The image presents a clinical decision support system interface displaying heart disease risk probabilities for six patients. It combines a tabular patient list with detailed risk factor analyses for two representative cases. The interface uses color-coded probability indicators (red-high, yellow-medium, green-low) and provides explanatory factors for each prediction.
### Components/Axes
1. **Left Table Structure**
- **Headers**:
- "Patient Name" (left column)
- "Probability of Heart Disease" (right column)
- **Data Points**:
- Six redacted patient entries with probabilities: 94%, 79%, 55%, 49%, 31%, 26%
- Color-coded ovals: Red (94%, 79%), Yellow (55%, 49%), Green (31%, 26%)
2. **Right Panels**
- **Top Panel** (79% High Risk):
- Header: "Probability of Heart Disease" (purple header)
- Timestamp: "7/21/2021 20:26"
- Risk Level: "High" (black text on red background)
- Contributing Factors:
- Thallium Stress Test: Normal
- Number of Major Vessels: 1
- Exercise Induced Angina: No
- Chest Pain Type: Typical Angina
- Max Heart Rate Achieved: 174
- Sex: Male
- **Bottom Panel** (26% Low Risk):
- Header: "Probability of Heart Disease" (purple header)
- Timestamp: "7/21/2021 20:26"
- Risk Level: "Low" (black text on green background)
- Contributing Factors:
- Thallium Stress Test: Normal
- Max Heart Rate Achieved: 131
- Number of Major Vessels: 1
- Sex: Male
- ST Depression: 0.10
- Age: 69
### Detailed Analysis
1. **Probability Distribution**
- High Risk (≥70%): 2 patients (94%, 79%)
- Medium Risk (50-69%): 2 patients (55%, 49%)
- Low Risk (<50%): 2 patients (31%, 26%)
2. **Risk Factor Correlations**
- **High Risk Case**:
- Elevated max heart rate (174 bpm)
- Presence of typical angina
- Male sex
- Single major vessel involvement
- **Low Risk Case**:
- Moderate max heart rate (131 bpm)
- Minimal ST depression (0.10 mm)
- Older age (69 years)
- Single major vessel involvement
3. **Temporal Consistency**
- Both detailed assessments share identical timestamps (7/21/2021 20:26), suggesting synchronized system calculations.
### Key Observations
1. **Color-Coding Accuracy**
- Red ovals consistently represent probabilities ≥70%
- Yellow ovals represent 50-69% probabilities
- Green ovals represent <50% probabilities
2. **Factor Weighting Patterns**
- Max heart rate >150 bpm appears in high-risk cases
- ST depression >0.05 mm correlates with increased risk
- Male sex appears in both high and low-risk cases but with different factor combinations
3. **Anomalies**
- Patient with 55% probability (yellow) shows no explicit risk factors in the detailed panels
- 31% probability case includes ST depression as a mitigating factor
### Interpretation
The system demonstrates a multi-factorial risk assessment model that integrates:
1. **Physiological Parameters**: Max heart rate, ST depression, and vessel count
2. **Clinical Findings**: Angina presence and chest pain type
3. **Demographic Data**: Age and sex
The high-risk case (79%) exemplifies classic coronary artery disease presentation with typical angina and elevated heart rate, while the low-risk case (26%) shows age-related changes without significant ischemia. The model appears to use Bayesian probability calculations, updating risk estimates based on new test results (Thallium Stress Test) and clinical findings.
The identical timestamps suggest real-time updating capability, though the lack of patient identifiers limits longitudinal analysis. The system's color-coded interface enables rapid clinical decision-making, with red alerts requiring immediate intervention protocols.