## Chart: Performance Comparison of Different Methods
### Overview
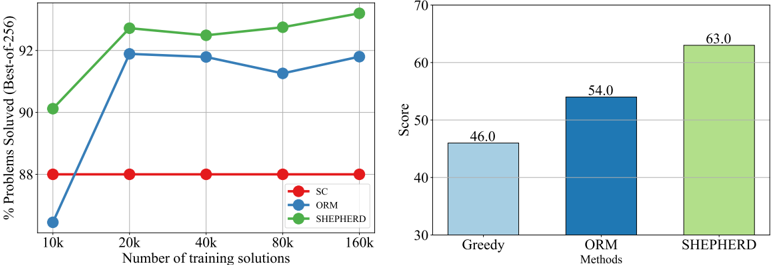
The image presents two charts comparing the performance of different methods (SC, ORM, SHEPHERD, and Greedy). The left chart is a line graph showing the percentage of problems solved by SC, ORM, and SHEPHERD as the number of training solutions increases. The right chart is a bar graph comparing the scores of Greedy, ORM, and SHEPHERD methods.
### Components/Axes
**Left Chart:**
* **Title:** None explicitly provided, but can be inferred as "Performance vs. Training Solutions"
* **X-axis:** Number of training solutions (10k, 20k, 40k, 80k, 160k)
* **Y-axis:** % Problems Solved (Best-of-256), ranging from approximately 86% to 94%.
* **Legend:** Located in the bottom-right corner.
* SC (Red line)
* ORM (Blue line)
* SHEPHERD (Green line)
**Right Chart:**
* **Title:** None explicitly provided, but can be inferred as "Score Comparison"
* **X-axis:** Methods (Greedy, ORM, SHEPHERD)
* **Y-axis:** Score, ranging from 30 to 70.
### Detailed Analysis
**Left Chart (Line Graph):**
* **SC (Red):** The line is relatively flat at approximately 88% across all training solution numbers.
* 10k: 88%
* 20k: 88%
* 40k: 88%
* 80k: 88%
* 160k: 88%
* **ORM (Blue):** The line increases sharply from 10k to 20k, then plateaus and slightly decreases.
* 10k: 86%
* 20k: 92%
* 40k: 92%
* 80k: 91%
* 160k: 91.5%
* **SHEPHERD (Green):** The line increases from 10k to 20k, plateaus slightly, and then continues to increase.
* 10k: 90%
* 20k: 93%
* 40k: 92.5%
* 80k: 93%
* 160k: 93.5%
**Right Chart (Bar Graph):**
* **Greedy (Light Blue):** Score of 46.0
* **ORM (Blue):** Score of 54.0
* **SHEPHERD (Green):** Score of 63.0
### Key Observations
* SC's performance remains constant regardless of the number of training solutions.
* ORM and SHEPHERD show significant improvement from 10k to 20k training solutions.
* SHEPHERD consistently outperforms ORM and SC in the line graph.
* SHEPHERD has the highest score in the bar graph, followed by ORM and then Greedy.
### Interpretation
The data suggests that increasing the number of training solutions beyond 20k has a diminishing return for ORM and SHEPHERD. SC's performance is unaffected by the number of training solutions, indicating it might be limited by other factors. SHEPHERD appears to be the most effective method overall, achieving the highest percentage of problems solved and the highest score. The bar graph complements the line graph by showing the final scores of different methods, including Greedy, which was not present in the line graph. The relationship between the number of training solutions and the performance of ORM and SHEPHERD is evident, highlighting the importance of sufficient training data for these methods.