## Line Chart: % Problems Solved vs. Training Solutions
### Overview
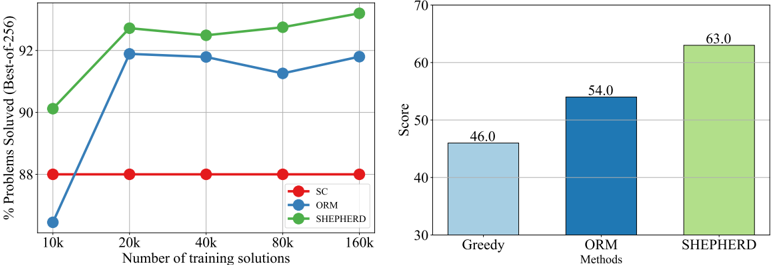
A line chart comparing three methods (SC, ORM, SHEPHERD) across varying numbers of training solutions (10k to 160k) in terms of "% Problems Solved (Best-of-256)".
### Components/Axes
- **X-axis**: "Number of training solutions" (10k, 20k, 40k, 80k, 160k).
- **Y-axis**: "% Problems Solved (Best-of-256)" (88% to 94%, with axis labels up to 92%).
- **Legend**:
- **SC**: Red line (flat at 88%).
- **ORM**: Blue line (peaks at 92% at 20k, dips to ~91% at 80k, rises to 92% at 160k).
- **SHEPHERD**: Green line (rises from 90% at 10k to 94% at 160k).
- **Legend Position**: Bottom-right corner.
### Detailed Analysis
- **SC**: Flat line at 88% across all training solutions.
- **ORM**:
- Starts at 86% (10k), jumps to 92% (20k), remains stable (~92%) at 40k and 160k, dips to ~91% at 80k.
- **SHEPHERD**:
- Starts at 90% (10k), increases steadily to 94% (160k).
### Key Observations
- SHEPHERD consistently outperforms SC and ORM as training solutions increase.
- ORM shows volatility (e.g., dip at 80k) but generally matches SHEPHERD’s performance at higher training volumes.
- SC remains stagnant regardless of training scale.
- SHEPHERD’s y-axis value (94%) exceeds the labeled axis maximum (92%), suggesting a potential axis truncation or data anomaly.
## Bar Chart: Method Scores
### Overview
A bar chart comparing three methods (Greedy, ORM, SHEPHERD) by "Score" (30–70).
### Components/Axes
- **X-axis**: Methods (Greedy, ORM, SHEPHERD).
- **Y-axis**: "Score" (30–70).
- **Legend**:
- **Greedy**: Light blue bar (46.0).
- **ORM**: Dark blue bar (54.0).
- **SHEPHERD**: Green bar (63.0).
- **Legend Position**: Top-right corner.
### Detailed Analysis
- **Greedy**: Lowest score (46.0).
- **ORM**: Mid-range score (54.0).
- **SHEPHERD**: Highest score (63.0).
### Key Observations
- SHEPHERD dominates in both charts, outperforming ORM and Greedy by significant margins.
- ORM’s score (54.0) aligns with its line chart performance (~91–92% problem-solving).
- Greedy’s low score (46.0) contrasts with its line chart baseline (88%), indicating a different evaluation metric.
## Interpretation
1. **Performance Trends**:
- SHEPHERD demonstrates superior scalability and efficiency, achieving higher problem-solving rates and scores across all training scales.
- ORM’s volatility (e.g., dip at 80k) suggests potential instability or sensitivity to training data size.
- SC’s flat performance implies it is either capped or ineffective at leveraging additional training data.
2. **Method Comparison**:
- SHEPHERD’s consistent dominance in both charts highlights its robustness, possibly due to advanced optimization or algorithmic design.
- The bar chart’s "Score" metric (likely a composite or alternative evaluation) reinforces SHEPHERD’s superiority, even when compared to simpler methods like Greedy.
3. **Anomalies**:
- SHEPHERD’s y-axis value (94%) exceeding the labeled maximum (92%) warrants investigation—potential axis mislabeling or data outlier.
- ORM’s dip at 80k training solutions may indicate a temporary degradation or overfitting.
4. **Implications**:
- SHEPHERD is the most reliable method for scaling with training data.
- SC’s stagnation suggests it may not be suitable for dynamic or large-scale problem-solving tasks.
- The bar chart’s "Score" metric could reflect real-world applicability, where SHEPHERD’s higher score translates to practical advantages.