## Bar Chart: Accuracy and Error Metrics Across Verification Types and Datasets
### Overview
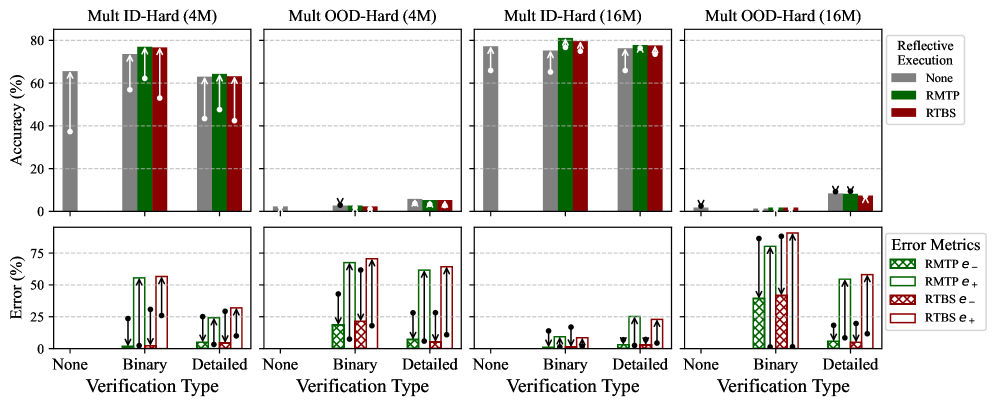
The image presents a comparative analysis of model performance across four datasets (Mult ID-Hard 4M, Mult OOD-Hard 4M, Mult ID-Hard 16M, Mult OOD-Hard 16M) using three verification types (None, Binary, Detailed) and two methods (RMTP, RTBS). Accuracy and error metrics are visualized using grouped bar charts with error bars.
### Components/Axes
- **X-Axes**:
- Labeled "Verification Type" with categories: None, Binary, Detailed.
- Repeated across four sub-charts (one per dataset).
- **Y-Axes**:
- Top row: "Accuracy (%)" (0–80 scale).
- Bottom row: "Error (%)" (0–75 scale).
- **Legends**:
- Right-aligned, with color coding:
- Gray: None
- Green: RMTP
- Red: RTBS
- Bottom row includes error metric labels:
- Green crosshatch: RMTP e⁻
- Green solid: RMTP e⁺
- Red crosshatch: RTBS e⁻
- Red solid: RTBS e⁺
### Detailed Analysis
#### Accuracy Trends
1. **Mult ID-Hard (4M)**:
- **None**: ~65% accuracy.
- **RMTP**: ~75% accuracy (highest).
- **RTBS**: ~70% accuracy.
- Error bars show moderate variability for all methods.
2. **Mult OOD-Hard (4M)**:
- **None**: ~5% accuracy (lowest).
- **RMTP**: ~5% accuracy (matches None).
- **RTBS**: ~5% accuracy (matches None).
- Error bars are minimal, indicating low variability.
3. **Mult ID-Hard (16M)**:
- **None**: ~75% accuracy.
- **RMTP**: ~80% accuracy (highest).
- **RTBS**: ~78% accuracy.
- Error bars are small, suggesting consistent performance.
4. **Mult OOD-Hard (16M)**:
- **None**: ~5% accuracy.
- **RMTP**: ~5% accuracy.
- **RTBS**: ~5% accuracy.
- Error bars are negligible.
#### Error Metrics
- **RMTP e⁻/e⁺**:
- **Mult ID-Hard (4M)**: e⁻ ~25%, e⁺ ~50%.
- **Mult OOD-Hard (4M)**: e⁻ ~5%, e⁺ ~25%.
- **Mult ID-Hard (16M)**: e⁻ ~10%, e⁺ ~20%.
- **Mult OOD-Hard (16M)**: e⁻ ~5%, e⁺ ~15%.
- **RTBS e⁻/e⁺**:
- **Mult ID-Hard (4M)**: e⁻ ~30%, e⁺ ~60%.
- **Mult OOD-Hard (4M)**: e⁻ ~5%, e⁺ ~30%.
- **Mult ID-Hard (16M)**: e⁻ ~15%, e⁺ ~40%.
- **Mult OOD-Hard (16M)**: e⁻ ~5%, e⁺ ~25%.
### Key Observations
1. **Accuracy**:
- RMTP consistently outperforms RTBS and None in ID-Hard datasets (4M and 16M).
- In OOD-Hard datasets, all methods perform poorly (~5% accuracy), with no significant differences.
2. **Error Metrics**:
- RMTP generally has lower error rates (e⁻) than RTBS, especially in ID-Hard datasets.
- Error variability (error bars) is highest for RTBS in Detailed verification (e.g., ~40% e⁺ in Mult ID-Hard 16M).
3. **Verification Type Impact**:
- Detailed verification correlates with higher error rates (e.g., RTBS e⁺ spikes to ~60% in Mult ID-Hard 4M).
### Interpretation
The data suggests that **RMTP** is more robust than RTBS in ID-Hard scenarios, achieving higher accuracy and lower error rates. However, both methods fail catastrophically in OOD-Hard datasets, indicating a lack of generalization. The Detailed verification type introduces higher error variability, possibly due to increased complexity or overfitting. The error metrics (e⁻/e⁺) highlight that RMTP’s performance is more stable (smaller error bars) compared to RTBS, which exhibits greater inconsistency. This implies RMTP may be preferable for ID-Hard tasks, but neither method is viable for OOD-Hard challenges without further improvements.