# Technical Document Extraction: ArXiv Data Analysis Chart
## 1. Component Isolation
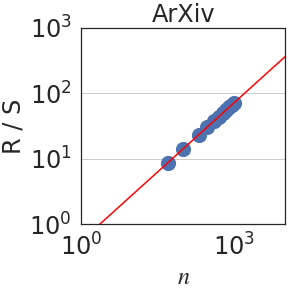
* **Header:** Contains the title "ArXiv".
* **Main Chart Area:** A log-log scatter plot with a superimposed linear regression line.
* **Axes:**
* **Y-axis (Vertical):** Labeled "R / S" with logarithmic scaling.
* **X-axis (Horizontal):** Labeled "$n$" with logarithmic scaling.
## 2. Metadata and Labels
| Element | Content |
| :--- | :--- |
| **Title** | ArXiv |
| **X-axis Label** | $n$ |
| **Y-axis Label** | R / S |
| **X-axis Markers** | $10^0$, $10^3$ |
| **Y-axis Markers** | $10^0$, $10^1$, $10^2$, $10^3$ |
| **Grid Lines** | Horizontal grid lines are present at $10^1$ and $10^2$. |
## 3. Data Series Analysis
### Series 1: Scatter Points (Blue Circles)
* **Visual Trend:** The data points form a tight, positive linear correlation on the log-log scale. The points are clustered more densely as they approach the higher end of the scale ($n \approx 10^3$).
* **Spatial Grounding:** The points begin at approximately $n \approx 10^{1.5}$ and $R/S \approx 10^{0.9}$ and extend to approximately $n \approx 10^3$ and $R/S \approx 10^{1.9}$.
* **Data Density:** There are approximately 12-15 visible blue circular markers.
### Series 2: Regression Line (Red Solid Line)
* **Visual Trend:** A solid red line slopes upward from the bottom-left toward the top-right.
* **Trend Verification:** The line acts as a "line of best fit" for the blue scatter points. Because this is a log-log plot, the straight line indicates a power-law relationship between $n$ and $R/S$.
* **Intercepts/Path:**
* The line passes through the coordinate $(10^0, 10^0)$.
* The line continues past the data points, reaching the right edge of the frame at approximately $n \approx 10^{3.5}$ and $R/S \approx 10^{2.5}$.
## 4. Technical Interpretation
This image represents a **Rescaled Range Analysis (R/S Analysis)** for a dataset labeled "ArXiv".
* **X-axis ($n$):** Represents the time span or window size.
* **Y-axis (R/S):** Represents the rescaled range.
* **Hurst Exponent ($H$):** In an R/S plot, the slope of the regression line on a log-log scale represents the Hurst exponent.
* Visually, the line rises approximately 2.5 log units over 3.5 log units of $n$.
* Estimated Slope ($H$): $\approx 2.5 / 3.5 \approx 0.71$.
* A Hurst exponent $0.5 < H < 1$ suggests long-term positive autocorrelation (persistence) in the ArXiv data series.
## 5. Precise Text Transcription
* **Top Center:** `ArXiv`
* **Y-axis Label:** `R / S`
* **X-axis Label:** `n`
* **Y-axis Scale:** `10^0`, `10^1`, `10^2`, `10^3`
* **X-axis Scale:** `10^0`, `10^3`