## Flowchart: System Architecture for Error & Slowdown Diagnosis
### Overview
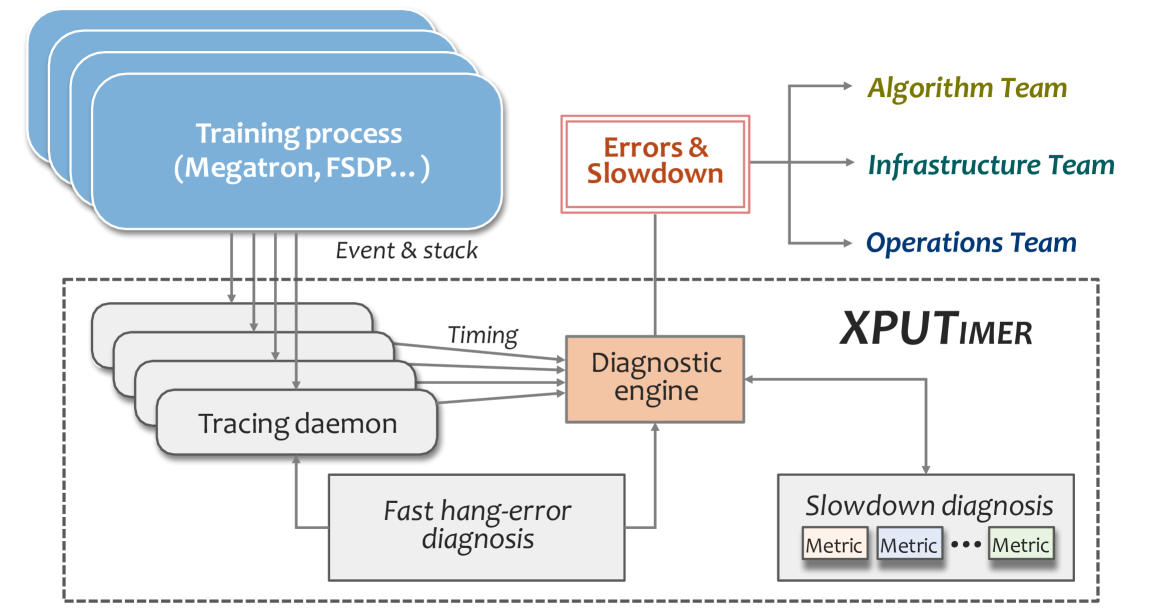
The diagram illustrates a technical workflow for diagnosing errors and slowdowns in a training process. It shows interactions between system components (training process, diagnostic engine, XPUTIMER) and three operational teams (Algorithm, Infrastructure, Operations). The flowchart emphasizes event tracing, timing analysis, and metric-based diagnosis.
### Components/Axes
**Key Elements:**
1. **Training Process** (Top-left)
- Sub-components: Megatron, FSDP (likely distributed training frameworks)
- Outputs: Event & stack data
2. **Diagnostic Engine** (Central)
- Inputs: Event/stack data, Timing signals
- Outputs:
- Fast hang-error diagnosis
- Slowdown diagnosis metrics
3. **XPUTIMER** (Bottom-right)
- Contains multiple metric boxes (color-coded)
- Connected to Slowdown diagnosis
**Legend Colors:**
- Green: Algorithm Team
- Teal: Infrastructure Team
- Blue: Operations Team
**Flow Direction:**
Top → Bottom (Training → Diagnostic Engine → XPUTIMER)
Left → Right (Event data → Timing analysis → Metric aggregation)
### Detailed Analysis
**Training Process Flow:**
- Blue rectangles represent training frameworks (Megatron, FSDP)
- Arrows show data flow to "Event & stack" collection
- Timing signals branch to Diagnostic Engine
**Diagnostic Engine Functionality:**
- Central orange rectangle processes:
- Fast hang-error diagnosis (direct output)
- Slowdown diagnosis (via XPUTIMER metrics)
- Receives input from:
- 5 parallel "Tracing daemon" instances
- Timing signals
**Team Responsibilities:**
1. **Algorithm Team** (Green)
- Connected to Errors & Slowdown box
- Likely handles model-related issues
2. **Infrastructure Team** (Teal)
- Connected to Errors & Slowdown box
- Manages hardware/environment issues
3. **Operations Team** (Blue)
- Connected to Errors & Slowdown box
- Handles system-wide operational problems
**XPUTIMER Metrics:**
- Contains 3+ colored metric boxes (exact count unclear)
- Represents aggregated performance indicators
- Connected to Slowdown diagnosis pathway
### Key Observations
1. **Centralized Diagnosis Hub:** The Diagnostic Engine acts as a single point of failure analysis
2. **Parallel Processing:** 5 Tracing daemons suggest distributed event monitoring
3. **Team Silos:** Clear separation of responsibilities by color-coded connections
4. **Metric-Driven Slowdown Analysis:** XPUTIMER's multiple metrics indicate granular performance tracking
5. **Timing-Critical Path:** Timing signals directly feed into diagnostic engine
### Interpretation
This architecture demonstrates a multi-layered approach to system monitoring:
1. **Preventive Maintenance:** Fast hang-error diagnosis suggests real-time failure detection
2. **Performance Optimization:** XPUTIMER's metrics enable proactive slowdown mitigation
3. **Team Coordination:** Color-coded connections reveal clear ownership boundaries
4. **Framework Agnosticism:** Support for multiple training frameworks (Megatron, FSDP) indicates scalability
The system prioritizes rapid error identification (fast hang-error) while maintaining detailed performance tracking through the XPUTIMER metric suite. The team structure implies a DevOps model with specialized expertise areas, though potential communication gaps between teams could exist given the siloed connections.