## Scatter Plot: college_computer_science
### Overview
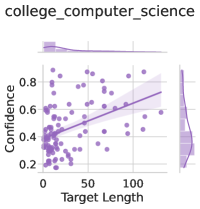
The image is a scatter plot titled "college_computer_science" showing the relationship between "Target Length" and "Confidence". The plot includes marginal distributions (histograms) for both variables along the axes. The scatter plot shows individual data points and a regression line with a confidence interval shaded around it.
### Components/Axes
* **Title:** college_computer_science
* **X-axis:** Target Length
* Scale: 0 to 100, with tick marks at 0, 50, and 100.
* **Y-axis:** Confidence
* Scale: 0.2 to 0.8, with tick marks at 0.2, 0.4, 0.6, and 0.8.
* **Data Points:** Each point represents a data entry. The points are colored in a light purple.
* **Regression Line:** A light purple line shows the linear regression fit to the data.
* **Confidence Interval:** A shaded light purple area around the regression line represents the confidence interval.
* **Marginal Distribution (X-axis):** A histogram above the scatter plot shows the distribution of "Target Length".
* **Marginal Distribution (Y-axis):** A histogram to the right of the scatter plot shows the distribution of "Confidence".
### Detailed Analysis
* **Target Length:** The data points are concentrated between 0 and 50, with fewer points beyond 50.
* **Confidence:** The confidence values range from approximately 0.2 to 0.8.
* **Trend:** The regression line slopes upward, indicating a positive correlation between "Target Length" and "Confidence".
* **Data Points:**
* At Target Length = 0, Confidence ranges from 0.2 to 0.6.
* At Target Length = 50, Confidence ranges from 0.3 to 0.8.
* At Target Length = 100, Confidence ranges from 0.5 to 0.8.
### Key Observations
* There is a positive correlation between Target Length and Confidence.
* The data is more densely populated at lower Target Length values.
* The confidence interval widens as Target Length increases, indicating greater uncertainty in the prediction for larger Target Length values.
### Interpretation
The scatter plot suggests that as the Target Length increases, the Confidence tends to increase as well. However, the spread of data points indicates that the relationship is not perfectly linear, and there is variability in Confidence for any given Target Length. The widening confidence interval suggests that predictions become less precise as Target Length increases. The concentration of data points at lower Target Length values indicates that the model is more frequently applied to shorter targets.