## Line Chart: Success Rate vs. Problem Size for Different Difficulties
### Overview
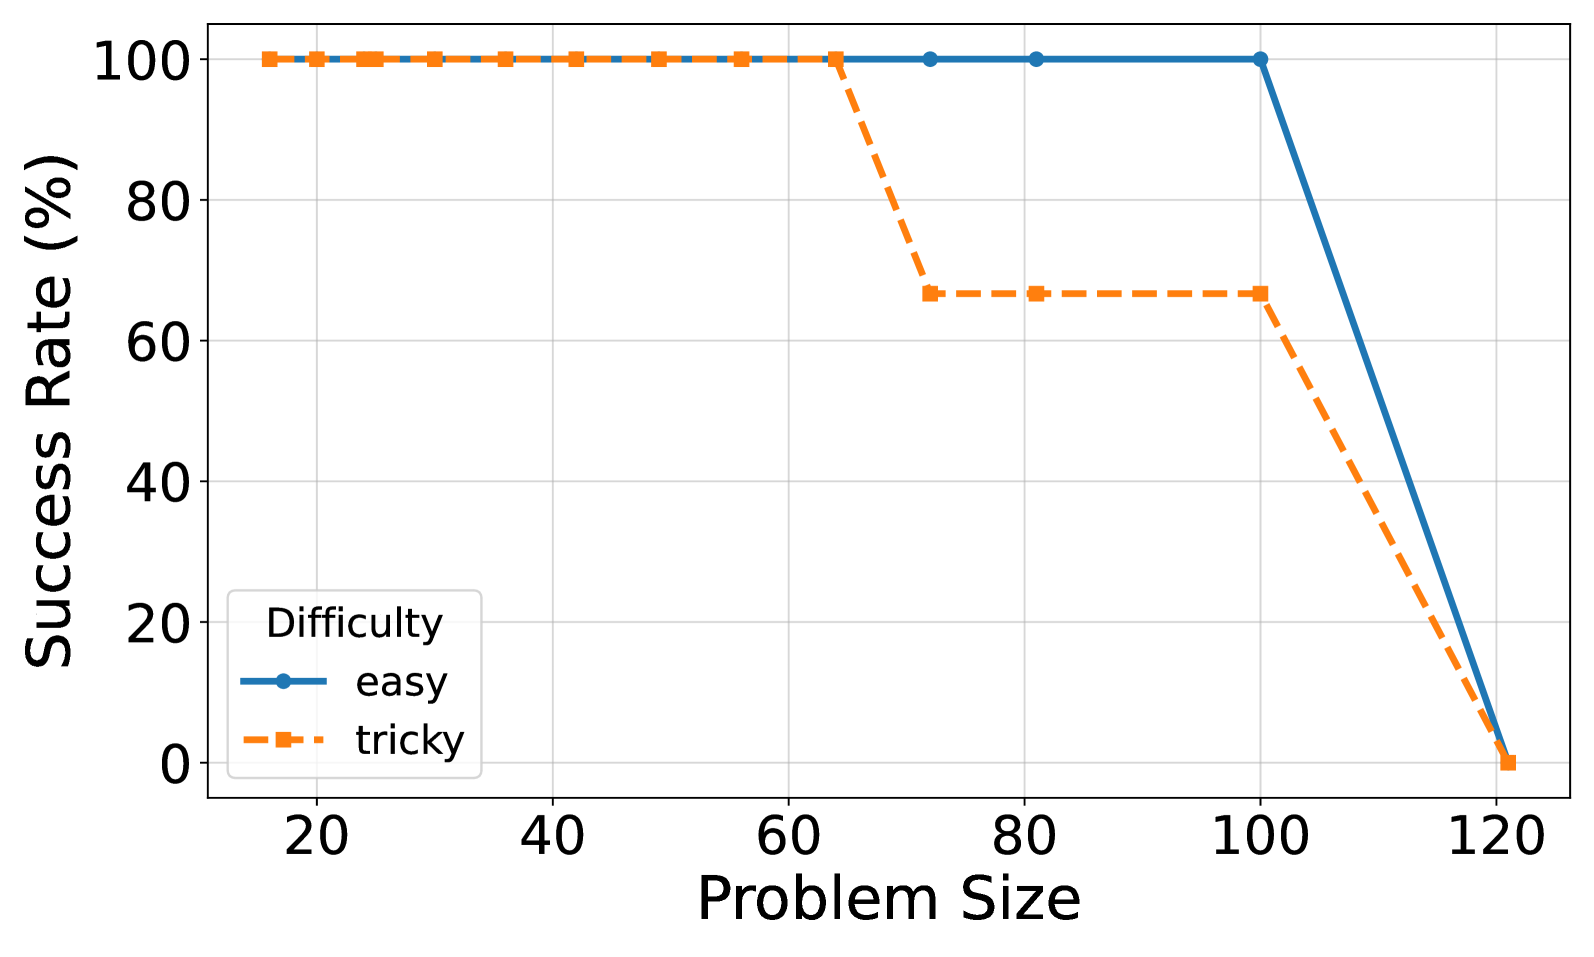
This line chart depicts the success rate (in percentage) as a function of problem size, comparing two difficulty levels: "easy" and "tricky". The x-axis represents the problem size, and the y-axis represents the success rate.
### Components/Axes
* **X-axis Title:** Problem Size
* **Y-axis Title:** Success Rate (%)
* **Legend:** Located in the bottom-left corner.
* **Difficulty: easy** (Solid Blue Line)
* **Difficulty: tricky** (Dashed Orange Line)
* **X-axis Scale:** Ranges from approximately 20 to 120, with markers at 20, 40, 60, 80, 100, and 120.
* **Y-axis Scale:** Ranges from 0 to 100, with markers at 0, 20, 40, 60, 80, and 100.
* **Gridlines:** Present to aid in reading values.
### Detailed Analysis
**Easy Difficulty (Blue Line):**
The blue line representing "easy" difficulty starts at approximately 98% success rate at a problem size of 20. It remains relatively constant at around 98-100% until a problem size of approximately 100. After 100, the success rate drops sharply, reaching approximately 20% at a problem size of 110 and 0% at a problem size of 120.
**Tricky Difficulty (Orange Dashed Line):**
The orange dashed line representing "tricky" difficulty begins at approximately 98% success rate at a problem size of 20. It remains relatively constant at around 98-100% until a problem size of approximately 80. From 80 to 100, the success rate decreases from approximately 70% to 65%. Between 100 and 120, the success rate declines rapidly, reaching approximately 0% at a problem size of 120.
**Data Points (Approximate):**
| Problem Size | Easy Success Rate (%) | Tricky Success Rate (%) |
|--------------|-----------------------|-------------------------|
| 20 | 98 | 98 |
| 40 | 99 | 99 |
| 60 | 100 | 99 |
| 80 | 100 | 70 |
| 100 | 98 | 65 |
| 110 | 20 | 10 |
| 120 | 0 | 0 |
### Key Observations
* Both difficulty levels exhibit high success rates for small problem sizes (up to approximately 80).
* The "easy" difficulty maintains a significantly higher success rate across most problem sizes.
* The "tricky" difficulty experiences a more substantial decline in success rate as the problem size increases, particularly after a problem size of 80.
* Both difficulties reach 0% success rate at a problem size of 120.
* The inflection point where the "tricky" difficulty begins to decline is around a problem size of 80.
### Interpretation
The data suggests that the "easy" problems are solvable with high accuracy even as the problem size increases, up to a certain point (around 100). Beyond this point, the success rate drops dramatically, indicating a limit to the algorithm's or solver's ability to handle larger instances of the "easy" problem.
The "tricky" problems are more sensitive to problem size. While they also have a high success rate for small problem sizes, their performance degrades much more rapidly as the problem size grows. This suggests that the "tricky" problems may require more computational resources or a different approach to solve effectively.
The fact that both difficulties reach 0% success rate at a problem size of 120 indicates a fundamental limitation in the method being used to solve these problems. This could be due to the problem becoming computationally intractable, or it could be due to limitations in the algorithm's design. The sharp decline in success rate for both difficulties around problem size 100-120 suggests a phase transition or a critical threshold in the problem's complexity.